Quantum Yield and Other Benign Amusements
If you've just landed here for the first time, this is a continuation of my October 17 blog Interrogating Plant Status in the Key of F where I pontificated, studiously I hope, on the phenomenon of fluorescence emission induction in plants. If fluorescence induction sounds Greek to you, I strongly urge you to go back and read that blog before proceeding. If you're an expert at PAM fluorometry, then everything that follows should be old hat, except for perhaps the fluorescence emission data, which are the grist of this second go-round.
Commercial PAM fluorometers are nothing new. High-grade units such as the Walz PAM-2500 and the Hansatech FMS 2 have been mainstays in photosynthesis research since the 1980s. While of excellent quality, these instruments are expensive and rather bulky, even though they're advertised as field "portable". They're not something I'd want to lug around for long periods, nor are they suited for high-throughput applications. The trend in instrumentation has been irresistibly the ever-shrinking form factor, while enhancing wireless broadband, user response, and cloud connectivity. The MultispeQ fits this mold: a pocket-sized, fast (<15 seconds per measurement, see my comments further on), multipurpose PAM fluorometer designed for outdoor use anywhere you can imagine trekking under the sun.1
Not only can the MultispeQ be manipulated with one hand in any position, but it's also Bluetooth 2 + EDR and micro-USB 2 enabled for pairing with your mobile phone or tablet for wireless transmission of in vivo fluorescence emission data to the PhotosynQ cloud server, nearly effortlessly.
Another compelling feature of the MultispeQ technology platform is its open architecture, which enables any researcher, citizen scientist, consultant, or intrepid farm operator to build, program, and deploy their own units for whatever purpose they see fit. Of course, this takes some tinkering with electronics, but the availability of off-the-shelf "plug and play" semiconductor components enables makers to branch off at a higher level right out of the gate. Saying that, MultispeQ is the brainchild of a group of photosynthesis and electrical engineering geeks at Michigan State University led by Dr. David Kramer. The guiding philosophy of MultispeQ, and that of its developers, can be summed up as participatory research encompassing the broadest possible audience to collect, analyze, discuss, and share information about plant photosynthesis. This doesn't preclude proprietary applications, but the accent is on sharing. Several YouTube clips by David Kramer are available, in which he articulates the goals and concepts driving the PhotosynQ vision. Unfortunately, the audio quality in these videos is subpar, so you'll need an ear trumpet to hear anything.
I stumbled on the MultispeQ in 2017, a year after its beta release. From the start, I was intrigued by the device's capabilities and the networking concept. The fact that the MultispeQ's sensor array output has been vetted against industry standards sets it apart from the wave of environmental sensors that have flooded the market recently. It wasn't long before I was scheming how to get my hands on a MultispeQ. The price was, and remains as of this writing, US$ 999, quite reasonable for a PAM fluorometer, but it is not in our budget. Fortunately, I was put in touch with a USDA plant physiologist at North Carolina State University who had recently purchased two MultispeQ devices for one of their projects. These were graciously loaned to us for the 2018 growing season to support our research. At the same time, we were conducting research on irrigation strategies for efficient corn production in North Carolina's lower coastal plain with a programmable overhead linear-move system capable of precision water placement. Since we were also doing extensive plant phenotyping for this project, it made sense to piggyback the MultispeQ assay using the corn hybrids as test subjects. The field design for this project is available here.
Briefly, we conducted five MultispeQ assays: two at vegetative growth stages V9 and V12; at tasseling (VT), and at milk (R3), and dent (R5) stages. Two independent measures were taken on a fully expanded leaf blade of six pre-selected and tagged corn plants, concurrently observed for a suite of phenotypic traits, in each of 24 field plots. At VT and thereafter, measurements were taken on the dominant corn ear leaf, ±1. Measuring commenced mid-morning and lasted through mid-to-late afternoon under existing atmospheric conditions: temperature, humidity, solar zenith angle, cloud cover. We sampled the plots incrementally by replication and plot number, beginning with plot 101 (replication 1) and proceeding to plots 201, 301, and 401. I don't know if this was the best approach for measuring chlorophyll a fluorescence in the field, but I felt it was the best way to complete the work in a timely manner while guarding against potential disruptions from the weather or other unforeseen events. A full description of field operations management related to this project is available here.
It may be noted that our experimental layout is a "fractional" factorial design with two corn hybrids, NK78S and P1870, planted at two population densities (30,000 and 40,000 plants per acre) with and without a 2x side-dress nitrogen application. The fractional design was necessary to keep the experimental footprint within the span of the overhead irrigation system while leaving a sufficient buffer zone between plots to accommodate bidirectional control of sprinkler nozzles "on" and "off" during operation. Consequently, the data have inherent statisical limitations, particularly in evaluating hybrid response. We'll keep this in mind later on.

Muhammad Atif Shabir and this blogger enjoy a subcontinental meal at the Kebab and Curry restaurant in Raleigh, NC, November 2018. Highly recommended!
Before going further, I want to give a shout-out to Muhammad Atif Shabir, a visiting scholar at Faisalabad University, Pakistan, without whose assistance I could never have contemplated a "side" project of this scale. As it happened, Mr. Shabir was looking for a field activity to engage with, and he was sent to me. I quickly realized this was a gift from Allah, as the Muslims would proclaim. I am indebted to Mr. Shabir for persevering many long, oppressive, sweat-inducing hours in the field; Yes, this is still largely how ag research is done, even here in the putative technological utopia of the United States. Mr. Shabir was throughout, present, helpful, and inquisitive. Insh'Allah, we'll meet again under Punjabi skies in fair Faisalabad.
Back in the field, Mr. Shabir and I got to hustling: he sampled one row of three individual plants, while I sampled the row adjacent to it. In this way, I could later test for systematic operator error (which turned out to be negative). Each measurement took about 50 seconds to finish. This was considerably longer than the advertised 15 seconds or less, but we were using V1.0, not the current V2.0, which may have faster electronics; I don't know. We used the default Leaf Photosynthesis MultispeQ V1.0 protocol to measure a suite of fluorescence and absorbance parameters, as well as several abiotic parameters.
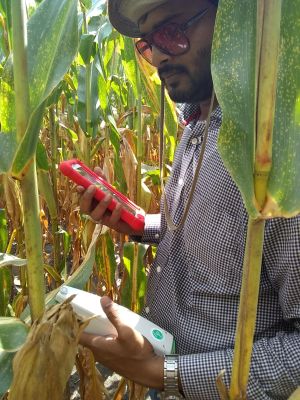
Taking leaf measurements is easily done by holding the MultispeQ in one hand and mobile device in the other.
Using the MultispeQ is easy. To begin, the operator opens the measuring head and inserts a leaf blade patch between the upper and lower arms. The light guide and surrounding seal should completely cover the leaf and be clamped securely to prevent outside light from entering. After answering a series of user-defined questions about the project, the operator taps the measure button on the PhotosynQ mobile app. While the instrument is running, it relays graphical information back to the PhotosynQ app, which can be easily monitored on a smartphone held in the operator's other hand (there are also desktop and web apps that I won't discuss). At the end of each measurement, readings or "traces" are assigned three different QC color codes: "green" indicating the measured parameters were within normal range; "yellow" if there's noise or some other problem, such as movement detected; and "red" if the readings are too noisy or out of the acceptable range. Ultimately, it's up to the operator to decide how to handle these different codes. This was a constant source of delay in our field progress. We adhered to a self-imposed protocol in which, for a given plot, at least 50% of the traces must be code green, with no code reds allowed. Thus, any red trace was deleted, and the measurement was repeated at another location on the same leaf. The developers state that there's no a priori reason to reject yellow or red traces. But we didn't want to take any chances, as there was no practical way to analyze traces on the go, nor to repeat measurements if we later found a problem. Ultimately, this was a good idea.
Before a trace is accepted, you can add notes, photos, review, or delete measurements as needed. Once the traces are accepted, they're cached on your mobile device until submitted to the PhotosynQ cloud server. Since we weren't within range of Wi-Fi in the field, traces were submitted as soon as we got back to the Cunningham Farm service center in Kinston. This was also a good time to check that all measurements were accounted for and in good standing before heading out.
So, what did we learn from this activity?
First, I downloaded the data to my desktop PC for review and post-processing. I confess it took several months to compile it all; the raw, unabridged files were quite large. Three fluorescence parameters were prioritized for analysis: effective quantum yield (ΦII), the quantum efficiency of Photosystem II; non-photochemical quenching components (ΦNPQ and ΦNO); and electron transport rate (ETR), defined as ETR = ΦII × PAR × 0.45, according to Kuhlgert et al. 2016. The fluorescence parameters ΦII, ΦNPQ, and ΦNO represent the main pathways, or "yields", for energy quenching in Photosystem II (PSII)2 and are related as pieces of the same pie: ΦII + ΦNPQ + ΦNO = 1. In this scheme, chlorophyll a fluorescence parameters are treated as mutually competing processes, with an increase in efficiency in one fraction occurring at the expense of another.
Quantum yield and non-photochemical quenching components were analyzed using analysis of covariance (ANCOVA) as generalized linear mixed models in SAS 9.4, with photosynthetic photon flux density (PPFD or "PAR") as a continuous covariate. In this way, photochemical response to irrigation and hybrid could be tested, controlling for radiant light intensity throughout the sampling period3. The ETR data were treated differently, as explained further on. In deference to brevity (and space), only tasseling (VT) data are dissected following. Happily, these data were also the most revealing for interpretive photochemistry.
The six panels in Figure 1 are from two sources: Panels A-C from a 2017 paper in the journal Remote Sensing showing the relationship between PPFD, that is, radiant energy in the 400 to 700 nm bandwidth, and chlorophyll a fluorescence parameters ΦII, NPQ, and related ETR in maize leaves estimated by the joint Fraunhofer Line Depth and Laser-Induced Saturation Pulse (FLD-LISP) method. This work is unique because it's the only published source of contactless chlorophyll a fluorescence that I've come across.
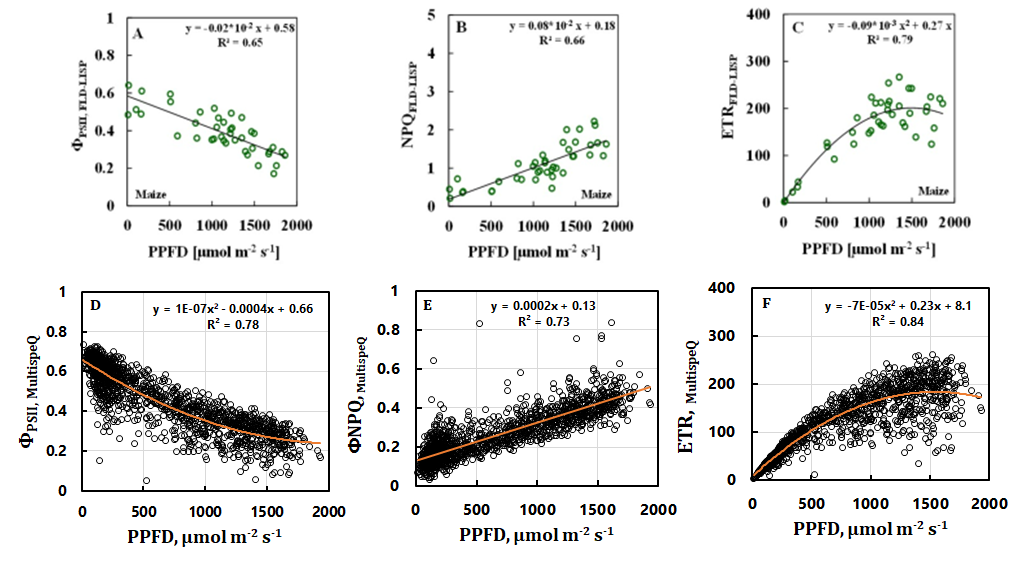
Figure 1. Relationship between photosynthetic photon flux density (PPFD) and maize leaf chlorophyll a fluorescence (CLFa) parameters. Panels A, B, and C, sourced from Rahinzadeh-Bajgiran et al. 2017, depict the Fraunhofer Line Depth-Laser-Induced Saturation Pulse (FLD-LISP) method. Panels C, D, E are corresponding CLFa measured by the MultispeQ PAM fluorometer from Walters and Shabir 2018.
According to the authors, the FLD-LISP method is a combined passive and active remote sensing tool with the potential to elicit long-distance, canopy-scale measurements of photochemistry and plant health in the field. The hitch, as so often, is that the results of this study were obtained under controlled conditions. In this case, maize plants, with two other non-agronomic species, were raised in an environmental growth chamber with controlled temperature, humidity, and lighting, in an artificial soil medium supplied with precisely calibrated water and nutrients. This is how most plant research begins, for good reason. It is much easier to detect plant signals under controlled conditions than in the open, where there's so much other "noise" in the environment to contend with. Ultimately, though, a phenotypic response detected under controlled conditions must be validated by measuring the same thing in the field, in a process called "ground-truthing" or "benchmarking". This is central to the emerging field of plant phenomics, which is critical for rapid assessment of genomic traits in plant science research and for engineering long-distance interrogation via remote sensing.
For comparison, beneath the FLD-LISP panels in Figure 1 are panels D, E, and F. These are replicate FLD-LISP parameters measured by the MultispeQ at Kinston in 2018. The Kinston data are aggregated over five growth stages from V9 to R5. Nevertheless, the impressions look similar to their FLD-LISP counterparts. Note that each panel in Figure 1 has a line slicing through the data points. These are regression lines showing how fluorescence parameters relate to PPFD. Each regression line has an associated equation and an R-squared (R2) value, the coefficient of determination. In a classical linear function f(x), the R-squared measures the degree of correspondence between the independent variable x and the dependent variable y. The R2 may take values from 0 to 1; generally, R2 values greater than 0.80 indicate a strong relationship between x and y, which we can rely on for predictive purposes.
Figure 1 shows that the relationship between ΦII and PPFD varies by source: the FLD-LISP method yields a linear fit, whereas the line slicing through our Kinston ΦII data shows curvature. We found that a 2nd-order polynomial estimated apparent ΦII more precisely than a simple linear function. Such curvature was detected in other parameters as we drilled down into the data. Also, note the two red arrows in Figure 1F. The upper arrow points to the clear outer envelope of the ETR "plume," while the lower arrow points to a diffuse inner envelope. It's my hypothesis that clear ETR envelopes signify a balanced train of electron transport in PSII; that is, plants with this type of ETR signature are able to self-regulate photochemistry, keeping the photosynthetic machinery humming even if under less than optimal conditions. On the other hand, diffuse irregular ETR envelopes implicate a perturbation, or uncoupling, of electron transport, and hence, photochemistry in PSII. In other words, something is out of whack. We'll return to this idea later on in our Kinston ETR data.
To summarize: The FLD-LISP method and our MultispeQ elicited a similar response from the activity of photochemical and non-photochemical quenching in PSII. This bodes well for benchmarking long-distance solar-induced fluorescence in the open. Now, let's drill deeper down.
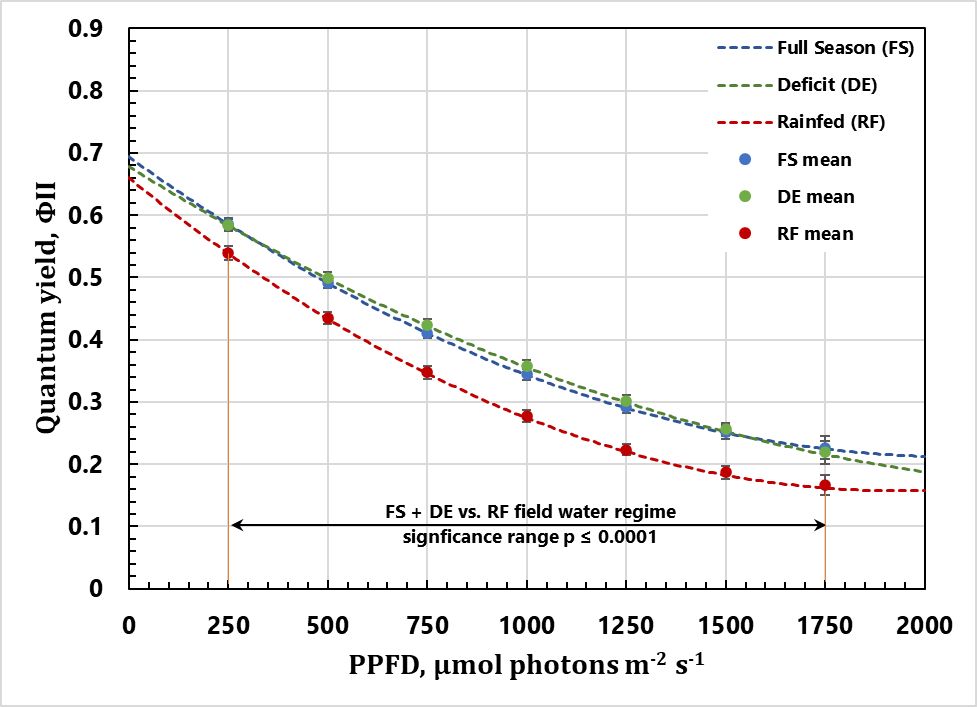
Figure 2. Relationship between photosynthetic photon flux density (PPFD) and quantum yield (ΦII) of Photosystem II in maize leaf at tasseling. The two vertical orange lines delineate the range of PPFDs at which average ΦII efficiency under rainfed (no supplemental irrigation) differed from that under full-season + deficit (VT ± 10 d) irrigation.
In Figure 2, the quantum yield response to PPFD is partitioned into three water-management components: full season, deficit, and rainfed (no supplemental irrigation). Deficit irrigation simulated conditions under which the supply of water was limited, such that supplemental irrigation was only applied 10 days before and after tasseling, coinciding with the development stage where maize is most sensitive to soil water deficit. Rainfed, or "dryland" maize, depends entirely on natural precipitation to satisfy the crop water demand.
There are several interesting observations to make from this. First, the dashed trend lines are estimates of ΦII interpolated from model-derived regression equations. In so doing, the scatter of measured data points has been squelched to avoid chart clutter. The solid circles perched on the lines represent the mean quantum efficiency at each of the seven PPFDs, calculated using least-squares regression in SAS 9.4's Mixed Procedure. The open circles are the centered means, i.e., the overall mean quantum yield adjusted for the covariate PAR in the model. Second, note that quantum efficiency decreases with rising PPFD. At PPFD >1,500 µmol/m2/s, the apparent quantum efficiency did not exceed 22%, a fraction of the theoretical maximum efficiency of 85.4% for maize reported by Bjorkman and Demmig (1987). This may appear counterintuitive as maize has evolved mechanisms like the carbon-4 (C-4) metabolism to thrive under elevated temperature and incident light, compared to carbon-3 wheat and soybean. Nonetheless, sun-adapted plants may activate photoprotective mechanisms even in diffuse light. Third, the nature of the quantum yield response can be observed across a broad range of PPFDs, with maize quantum efficiency downrated by up to 27% under no irrigation compared with full-season and deficit irrigation. This implicates a direct link between the operating efficiency of PSII activity in maize leaves under mild drought stress and grain yield. Although the period around tasseling was relatively dry, with four rain-free days before tasseling on July 7, and ten days after with < 2.5 mm (0.10") precipitation, this "mini drought" reduced corn grain yield by 23.1%, on average, under no irrigation. Typical symptoms of moisture stress in maize include diurnal leaf rolling, seen in Figure 3. Normally, the plant recovers after dark, but the damage done is irreversible.
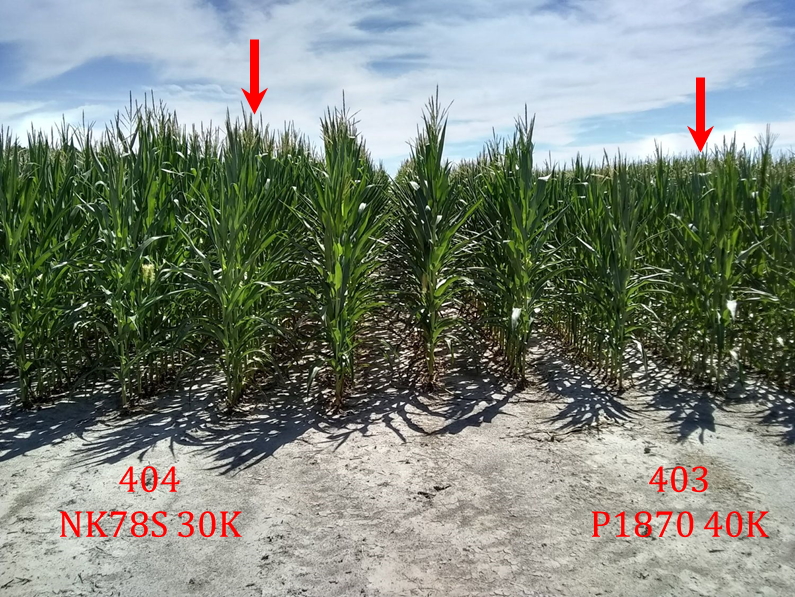
Figure 3. Maize plants exhibiting stress. Leaf rolling is a natural plant response to high temperature and available moisture aimed at limiting water loss through the leaf cuticle via transpiration. Red arrows point out the visible difference in plant height between hybrids and planting density.
Paradoxically, 2018 was near record-breaking for precipitation at Kinston and across North Carolina: 162.46 cm (63.96") were officially recorded at the Cunningham station. In contrast, the thirty-year average stands at 126.82 cm (49.93"). But this is something we in the US southeast have had to contend with forever: too much rain when you don't need it and too little when you do. It's the reason, contrary to the display of lush countryside everywhere in North Carolina, that research has shown irrigation is profitable in most years and for most crops. Even relatively brief periods of high water consumption (mainly transpiration) when coupled with inadequate supply (xylem transmission) can wreak havoc on canopy-scale photochemistry, and in turn, reduce crop yield in ways that are quantifiable but imperceptible to the human senses. Saying that, PAM fluorometers can be misleading because the light guide samples only a small fraction of the leaf area, 64 mm2 exactly for the MultispeQ. Leaves may be exposed to direct or diffuse light at different times of the day. As such, measures of plant productivity, such as yield and biomass, depend on integrating canopy-scale photosynthesis with other factors, including leaf area index, leaf angle, and shading. This is well beyond the ability of PAM fluorometers to assess.
Moving further on, Figures 4 and 5 portray ΦNPQ and ΦNO response to PPFD at tasseling.
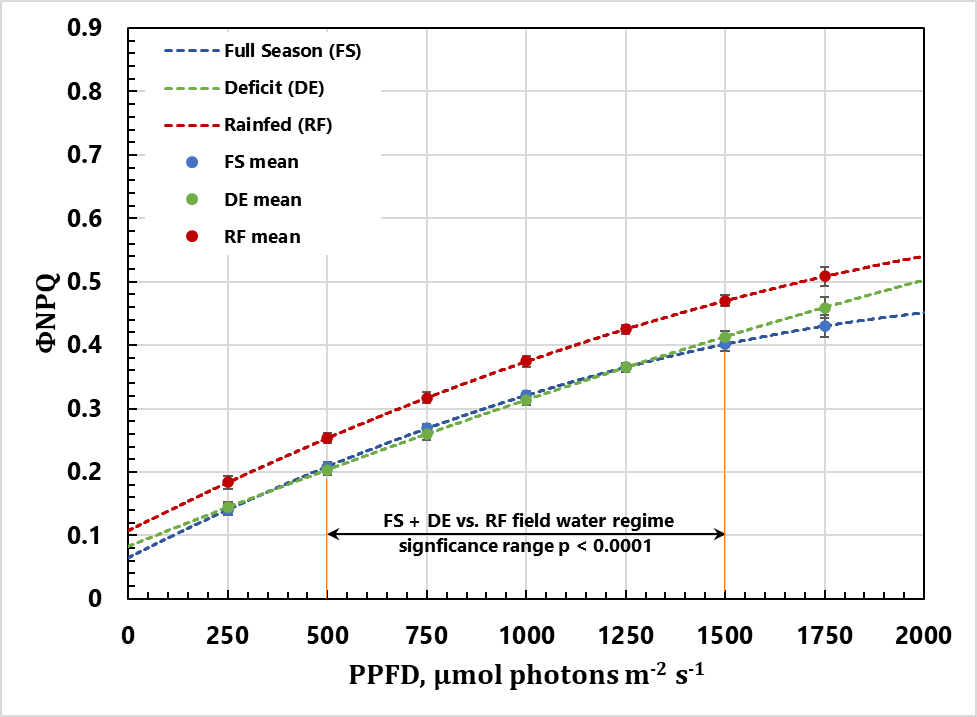
Figure 4. Relationship between photosynthetic photon flux density (PPFD) and regulated non-photosynthetic quenching (ΦNPQ) of Photosystem II in maize leaf at tasseling. The two vertical orange lines delineate the range of PPFDs at which average ΦNPQ differed between rainfed (no supplemental irrigation) and full-season + deficit (VT±10 d) irrigation.
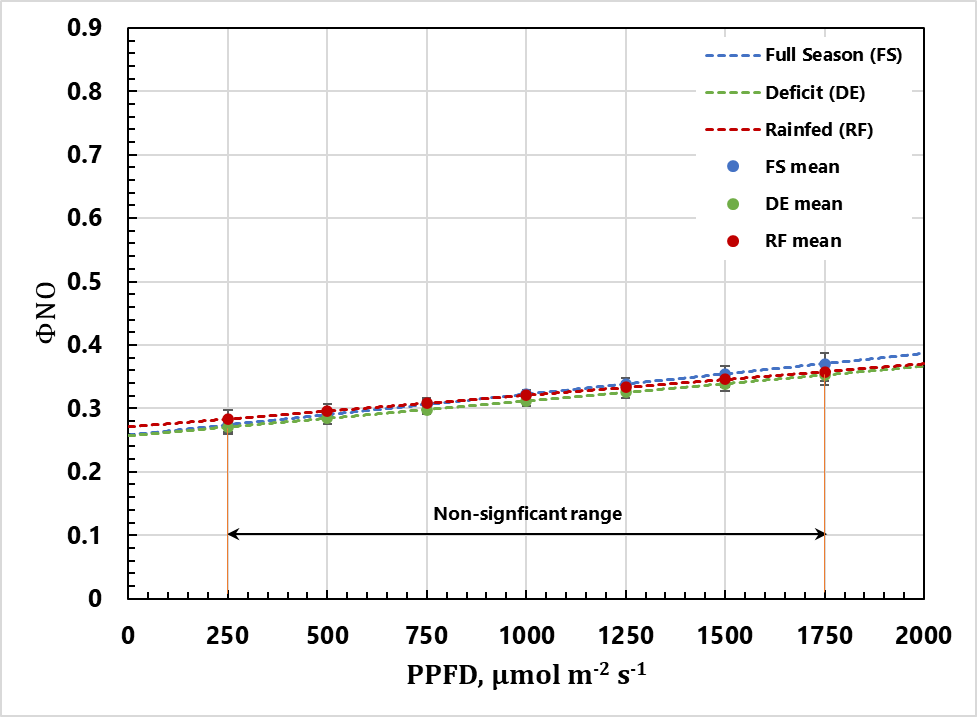
Figure 5. Relationship between photosynthetic photon flux density (PPFD) and unregulated non-photosynthetic quenching (ΦNO) of Photosystem II in maize leaf at tasseling. The two vertical orange lines delineate the range of PPFDs over which no differences in ΦNO were detected.
Remembering that ΦNPQ and ΦNO are related to quantum yield, ΦII as ΦII + ΦNPQ + ΦNO = 1, the ΦNPQ response in Figure 4 looks roughly like an inversion of ΦII in Figure 2. But what about ΦNO? In Figure 5, ΦNO increases linearly with PPFD, but overall, there's no response to irrigation. To interpret this, we return to the definitions of these two parameters: ΦNPQ is an energy-partitioning parameter that indicates the fraction of energy dissipated via regulated non-photochemical quenching. Whereas ΦNO indicates how much energy is dissipated by unregulated non-photochemical processes.
My interpretation of ΦNO is that it's evidence of self-regulating energy-dissipation processes taking control during periods of stress, as nature intended. If, however, we observed a spike in ΦNO in any of the irrigation treatments, this would signal that unregulated quenching processes were dominating. This concept is perhaps better visualized in Figure 6, where the mean quantum yield and non-photosynthetic quenching are plotted side by side for comparison.
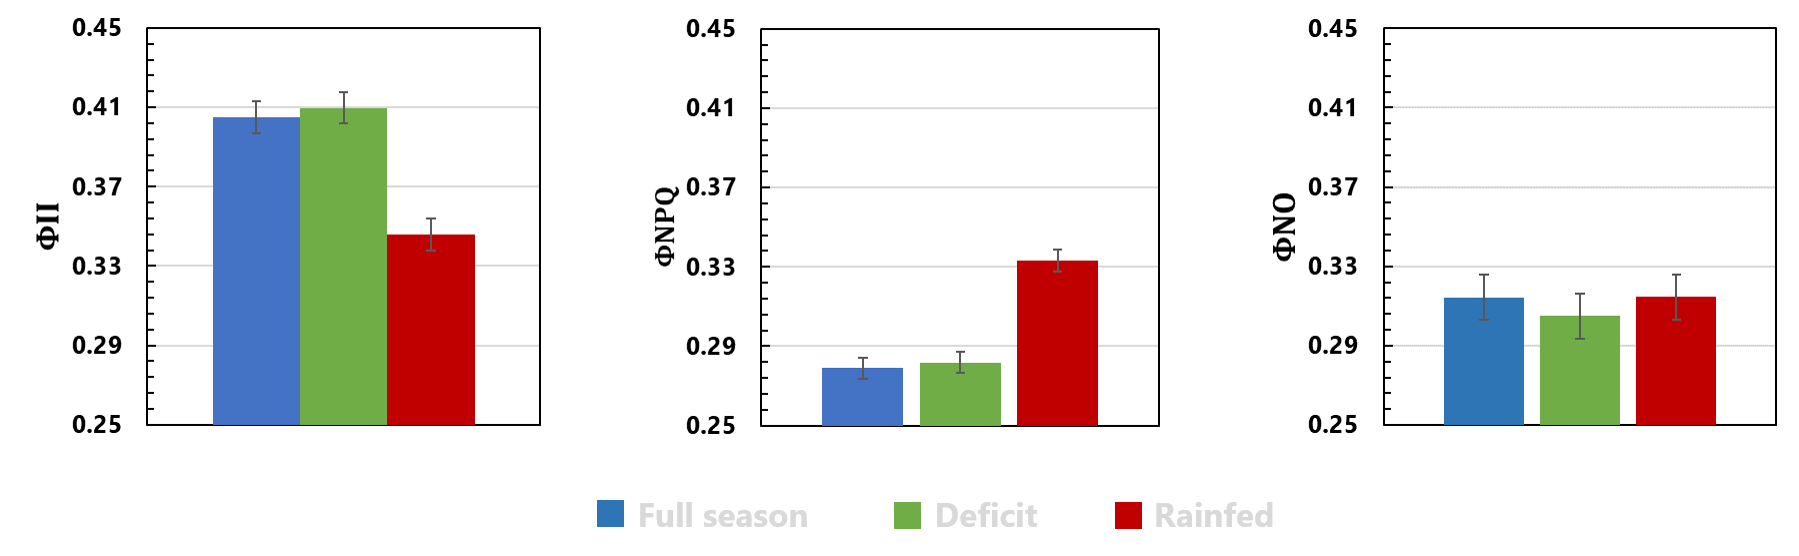
Figure 6. (A) Quantum yield (ΦII), (B) yield of regulated non-photochemical quenching (ΦNPQ), and (C) unregulated processes (ΦNO) under three soil water management regimes. Solid color bars are the mean yield adjusted for photosynthetic photon flux density (PPFD). Black vertical lines are the standard error for the mean.
A key observation from Figure 6 is that the ΦII and ΦNPQ responses appear roughly opposite, or inversely proportional, with respect to irrigation, whereas ΦNO is relatively indifferent.
This suggests that some maize hybrids exhibit photochemical resilience under environmental stress. This is great news for farmers who depend on improved genetics to smooth out the inevitable bumps in the road from seed emergence to maturity. It's a nasty world out there, so the plant must be equipped with mechanisms to self-regulate and/or avoid stress to reach physiological maturity. Fortunately, evolution has endowed land plants with various mechanisms for survival; fluorescence emission and NPQ are just two examples. For the farmer, however, plant survival is no comfort. Any stress, no matter how slight, can impact plant metabolism, photochemistry, and ultimately, net carbon assimilation. It's left to the farmer's knowledge, operational savvy, and keen judgment at every point to optimize productivity. Those who've experienced the agony of defeat in crop failure understand it's a supremely hard act to follow.
Lastly, we consider ETR. Earlier, I mentioned that our fractional experimental design limited the inferences possible regarding maize hybrid and/or population density. To partially mitigate this constraint, I've broken down the ETR response by hybrid population density and irrigation, as shown in Figure 7.
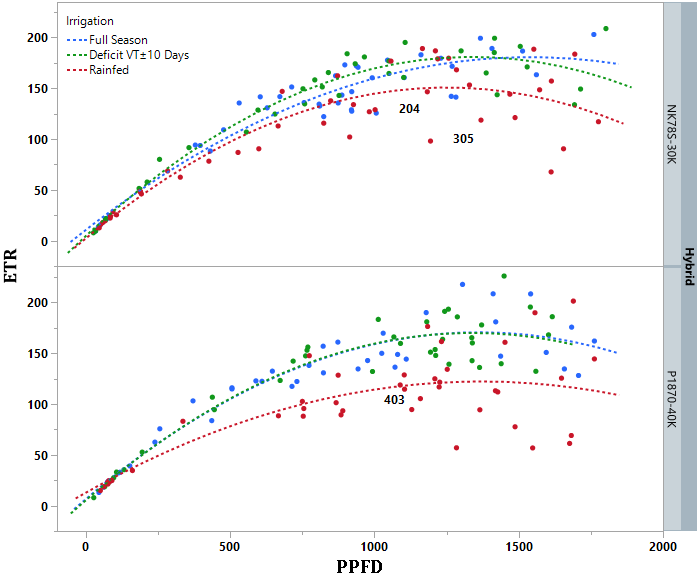
Figure 7. Relationship between photosynthetic photon flux density (PPFD) and electron transport rate (ETR) of Photosystem II in two maize hybrids under three soil water management regimes.
It can be observed in both hybrids that the trend lines for no-irrigation trailed well behind those for full-season and deficit irrigation, particularly at higher PPFDs. But hybrid P1870 trails considerably behind NK78S. It can also be noticed that the diffuse lower ETR boundary consists entirely of points estimated from plots where no supplemental irrigation was applied. Three such plots: 204, 305, and 403 are annotated in Figure 7. Not coincidentally, grain yield from these same plots placed in the lower 25th percentile. Recall above where I posited that a clear ETR envelope indicated normal self-regulation of the electron transport chain, whereas a diffuse envelope implicates a perturbation, or uncoupling, of electron transport, a kink, if you will, in the photochemical chain in PSII. The ETR envelopes in Figure 7 indicate that hybrid P1870 exhibited greater diffusion than NK78S. Also, recall that hybrid P1870 was planted at a higher population density: 40,000 plants per acre vs. 30,000 plants per acre for NK78S. The evidence from ETR analysis suggests that P1870 was overall less resilient in sustaining normal electron transport at tasseling; in particular, some plants in plot 403 were apparently stressed to the point of uncoupling. We observed similar ETR signatures at growth stage V12, when plant-to-plant competition for resources was at its peak (not shown). In short, the ETR analysis suggests that P1870's planting density was too high relative to the available resources, or that particular hybrid was not well adapted to higher populations, or both. In any case, ETR appears to be a highly sensitive and visually distinct marker of phenotypic adaptive capability in the field.
In summary, here are the main points taken from this trial:
- Near-distance FLD-LISP fluorescence (Rahinzadeh-Bajgiran et al. 2017) and the MultispeQ PAM fluorometer elicited similar responses from the activity of photochemical and non-photochemical quenching in PSII, and electron transport rate (ETR) in maize under varying photosynthetic photon flux density (PPFD).
- The apparent quantum efficiency of PSII in maize leaves decreased with rising PPFD, which did not exceed 22% of the maximum theoretical rate at PPFD >1,500 µmol/m2/s considered the average radiant intensity under full sunlight at mid-latitude.
- Under rainfed conditions, leaf quantum efficiency at tasseling was reduced up to 27% compared to deficit and full-season irrigation. Grain yield was also reduced by 23% without irrigation.
- Non-photochemical quenching components, ΦNPQ and ΦNO, responded as expected in well-regulated genotypes.
- ETR analysis suggests that it's a highly sensitive marker for phenotypic adaptive response in maize.
So, what's the final verdict on MultispeQ?
While the MultispeQ was able to predict yield loss at tasseling, it's not known how fluorescence emission signals propagate temporally or what their cumulative effect on plant performance is. More work on this is needed. Relating leaf-scale fluorescence to canopy-scale is trickier, something we could not attempt without access to solar-induced fluorescence imaging.
While we rate this pilot study a success, it's clear that MultispeQ is not the ideal solution for high-throughput phenotyping. Even though relatively speedy (we clocked about 50 seconds per measurement vs. 15 seconds claimed by developers) the time and labor involved in retrieving a statistically reliable sample from hundreds of field plots via MultispeQ would be prohibitive. In this regard, the MultispeQ is better suited for benchmarking long-distance fluorescence than for large-scale field phenotyping. Still, it's a great educational tool for quickly assessing fluorescence parameters, such as quantum efficiency, and, indirectly, plant health in the field. This should appeal to consultants and Extensionists, demonstrating the working principles of photosynthesis to growers. Greenhouse applications would also appear promising. In particular, we commend the PhotosynQ project's global reach and collaborative spirit.
Future maize assays should focus on taking multiple leaf measurements in a few selected genotypes from mid-morning to mid-afternoon, repeated weekly beginning V3 through R3 (milk stage). In this way, overlays of fluorescence traces may better assess diurnal and seasonal variation, providing more informative results than our discrete, one-shot growth-stage approach at Kinston. In maize, the time leading up to V6 is critical in determining yield components like final plant population, ears per plant, and kernel rows per ear. Therefore, it's critical to capture this period in any temporal analysis. Unfortunately, the first leaf assay was delayed due to wet ground conditions that delayed side-dressing until V9, long past the optimal time for this critical operation. So, we don't know how late side-dressing may have affected maize development and final grain yield, even after accounting for other factors.
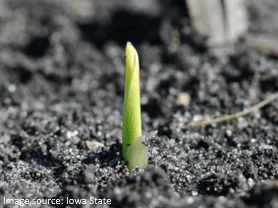
Image source: Iowa State
But that's how it goes. Every year brings fresh challenges. In the real world of agricultural field research, time is like digital pixel resolution: three years of data are better than one; five years even better; and ten years plus make for precision near- and long-term forecasts if you have the $$ to stretch it out that far. Most don't.
It's all in the tolerance for error, which is inescapable. Just keep a keen eye on emergence. You can't win without that.
End Notes
1 Each MultispeQ trace is tagged with a latitude and longitude. However, it's unclear whether it's retrieving this information from your mobile device or from an internal GPS receiver. Either way, the positional accuracy is probably no better than about 5 m (~16 ft) under ideal conditions. This should be kept in mind when conducting spatial analysis of experimental data. For plot- or plant-scale geotagging, you would need to carry a secondary device to incorporate higher-precision location information.
2 Fluorescence emission yield is not reported by the MultispeQ. Recall that fluorescence represents the fraction of radiant energy that does not enter the reaction centers of Photosystem II, so it's not an indicator per se of PSII activity.
3 The MultspeQ also measures leaf surface temperature using a contactless thermal IR sensor in the instrument head. In our VT sampling leaf surface measurements ranged from 28°C to 39°C. The ambient temperature at which photosynthetic activity typically decreases in maize is around 35°C, and it drops to zero around 43°C. Ambient and leaf temperatures vary with factors such as stomatal density and conductance, leaf thickness, and others. Leaf temperature information was not included in our predictive models. However, it's something to watch out for when evaluating PSII activity.
4 No inference is possible about hybrid NK78S at 40,000 plants per acre due to the fractional factorial design.
Further Diggings
Björkman, O., and B. Demmig. 1987. Photon yield of O2 evolution and chlorophyll fluorescence characteristics at 77 K among vascular plants of diverse origins. Planta 170, 489–504. https://doi.org/10.1007/BF00402983
Kuhlgert, S., Austic, G., Zegarac, R., Osei-Bonsu, I., Hoh, D., Chilvers, M.I., Roth, M.G., Bi, K., TerAvest, D., Weebadde, P., and D.M. Kramer. 2016. MultispeQ Beta: a tool for large-scale plant phenotyping connected to the open PhotosynQ network. Royal Society Open Science 3, 160592. https://doi.org/10.1098/rsos.160592
The author thanks the Corn Growers Association of North Carolina and Syngenta Biotechnology for their generous support of this work.
Disclaimer: Links to digital content in this blog are for the reader's information only, not an endorsement of that content.
Last update 02 Sept. 2024. The term 'critical stage' in the text and figures was replaced with 'deficit,' which more accurately describes the irrigation strategy employed in this study. Some minor editorial changes to the body of the text were also made.