Interrogating Plant Status in the Key of F
If plants could communicate with their tenders, what would they have to say?
This isn't an absurd hypothetical statement because plants do in fact, speak a language, though no human ear can perceive it. The language of plants is embedded in a complex of biochemical signals that are endlessly venting off in fragments of cryptic semaphore, day and night, without pausing until the end. Scientists have devised numerous ways of interrogating a plant's vital signs via semiconductor devices, optical sensors, and microchips and converting the signals to quantitative information about plant status: a data stream language, if you will. Photosynthesis is perhaps the most familiar trait distinguishing plants; it is, without exaggerating, the engine powering twenty-first-century society, for example: providing our daily sustenance, food, and the oxygen we breathe; energy production needed to heat our homes, cook our food, broadcst the internet, and fuel our modes of transportation. Human knowledge of photosynthesis dates back 350 years; yet our ability to elicit phenomenological information about its inner mechanisms has only gradually emerged since the 1930s. Chlorophyll fluorescence induction, or "F" as it's known by plant scientists, is one powerful technique used to probe the health and well-being of photosynthesis.
Photosynthesis takes place inside specialized cellular organelles called chloroplasts. Chloroplasts contain the pigment chlorophyll, which we associate with green leaves. This is because green is the wavelength reflected by the chlorophyll molecules and thus, detected by human vision. Generally, the darker green the leaf, the higher the chlorophyll concentration. Chlorophyll is found in other tissues like stems, sheaths, and petioles, but these often appear as lighter shades of green because their chlorophyll content is lower. Most terrestrial plants depend, by far, on chlorophyll in leaves for photosynthesis and carbohydrate synthesis. Algae and certain bacteria also are capable of photosynthesis, but here we'll limit this discourse to vascular plants like maize, wheat, soybean, and the odd Pelargonium.
For those unfamiliar with plant mechanisms, photosynthesis is a light-driven reaction that consumes water and carbon dioxide, which are converted to glucose and oxygen. When radiant energy from the sun strikes a leaf, only a small fraction is available to drive photosynthesis. Wavelengths between 400 to 700 nanometers (nm) are preferred; this fraction is called photosynthetically active radiation (PAR), which comprises about 45% of the solar spectrum when measured at ground level (Figure 1)1. About 78% of PAR is absorbed, while the rest is either reflected away from or transmitted through the leaf.2
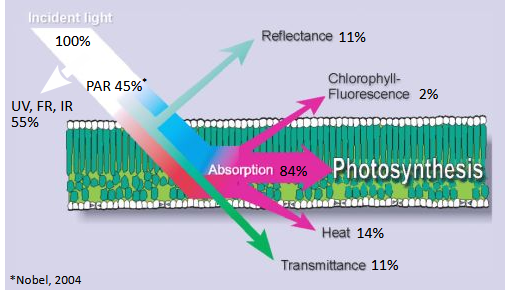
Figure 1. About 78% of photosynthetically active radiation (PAR) falling on a leaf is absorbed, while the rest is reflected or transmitted. The result of this solar broadband filtering is that ≤ 30% of incident light is available to drive photosynthesis. Photochemical inefficiency, photonic mismatch, and metabolic overhead further whittle the quantum efficiency of photosynthesis conversion of solar energy to biomass down to 0.5-1.3% at mid-latitude when averaged over the whole year (Bisio and Bisio 1997). Image adapted from ESA Bull. 116, 2003.
PAR roughly coincides with the visible spectrum of light sensible to the human eye. Radiant light, including PAR, is made up of small packets of energy called photons, which are the basic "quanta" or units of light. PAR is often quantified as photosynthetic photon flux density (PPFD) with units "micromoles per square meter per second" abbreviated µmol m-2 s-1. Under optimal conditions, about 84% of absorbed photons are available to drive photosynthesis, while about 14% are lost as heat, and only about 2% are re-emitted as fluorescent light. Keep in mind that these numbers are generalizations prone to seasonal variation, differences in latitude, solar zenith and leaf angle, and atmospheric conditions. In Figure 1, we adopted the 0.45 PAR solar broadband fraction, as defined by Howell et al. (1983) and Jacovides et al. (2003), measured at 36° and 35° North latitude, respectively, and by Nobel (2004). The 0.78 absorbance fraction is given by the European Space Agency (ESA Bulletin 116 2003), based on maximum absorption in the blue (400-500 nm) and red (600-700 nm) wavebands and reflectance and/or transmission in the green (500-600 nm), in good accordance with Goudriaan 2016. The 0.84 fraction is based on a standard maximum leaf absorption coefficient reported in Murchie and Lawson (2013).
If the word "fluorescence" conjures an image of radiation emanating from a body, this aptly conveys the phenomenon observed in plants. Chlorophyll fluorescence is a continuous signal broadcasting the state, or "well-being", of the photosynthetic apparatus. Fluorescence is normally invisible to the human eye except under special conditions, as revealed in this highly illuminating video. But where does this mysterious light come from?
In fact, fluorescence arises from the reaction centers in photosynthesis, which are located in the membranes of the chloroplast. When light energy enters the leaf of a plant, it is first captured by light-harvesting antenna pigments surrounding two reaction cores (Figure 2).
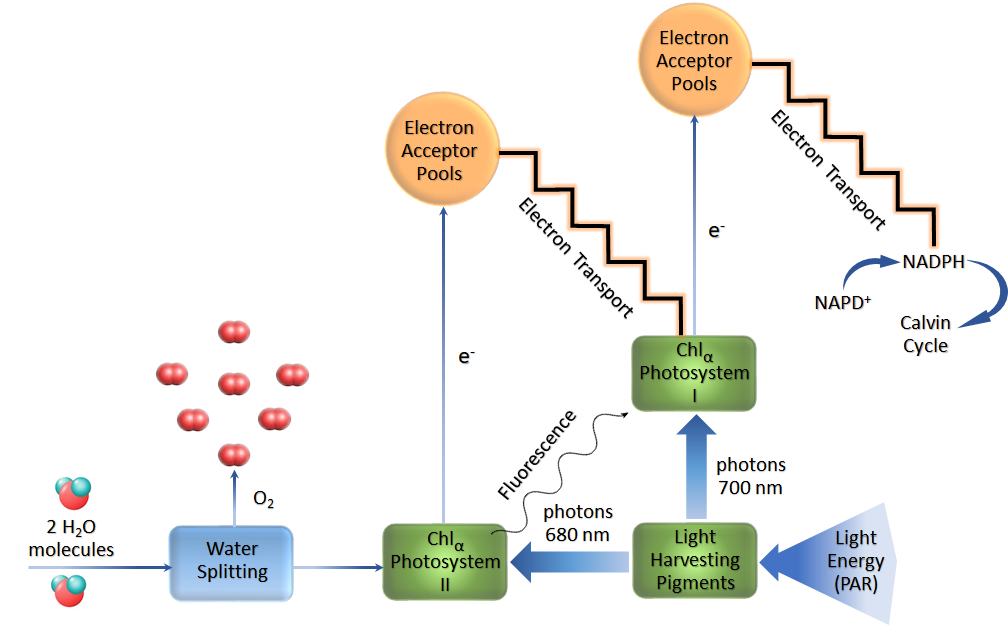
Figure 2. The "light" reaction of photosynthesis in generalized outline showing chlorophyll fluorescence emanating from Photosystem II. Photosystem I is weakly fluorescent (not shown) but has no variable component. Photosystem I and Photosystem II are designated by the order in which they were discovered, not the order of the reaction. Note that two molecules of water enter the reaction on the left side. Water is split to resupply electrons that are lost from Chlα in the PSII reaction center, generating free oxygen and a constant stream of electrons that feed into PSII. Source: adapted and re-drawn from Govindjee and Wilbert Veit.
Light energy enters Photosystem I (PSI) or Photosystem II (PSII), depending on the wavelength of the captured light: λ 680 nm or λ 700 nm. Both wavelengths are within the red spectral band (some higher-energy light in the blue band is also absorbed, but this is primarily funneled into PSII). When a chlorophyll a (Chlα) molecule in PSII absorbs a photon of light, one of its electrons is raised to a higher energy state. While in this excited state, the electron is trapped by an electron acceptor pool from which it cascades down through an electron transport chain into PSI, as shown in Figure 2. The process repeats itself, ultimately generating NADPH by chemical reduction of NADP+. NADPH provides the fuel for anabolic processes, such as fixing CO2 into sugar molecules, in a closely coupled process known as the Calvin cycle, or "dark" reaction, so named because it doesn't depend on light activation3. In this manner, photon (electromagnetic) energy absorbed by plants is converted into stored chemical energy.
Fluorescent radiation can be traced to photons that did not participate in the light reactions of photosynthesis. The acceptor pools in photosynthesis are easily swamped by incident light, even though the fraction of radiant energy absorbed by the leaf is very small. Somehow, the plant must use or dissipate this energy; otherwise, the photosynthetic apparatus could be damaged. When the electron acceptor pools are closed, excited electrons have nowhere to go. The end result is that free electrons will decay back to their ground state. The energy lost in this decay process is given off as fluorescent light. Excess light energy in the chloroplast activates biochemical reactions that generate free radicals, such as peroxides and other toxic oxygen species. In response, the plant produces antioxidants that scavenge these free radicals and neutralize them. However, this defense mechanism can be overwhelmed by intense sunlight, resulting in photodamage, as evidenced by symptoms such as leaf burning and scorching (Figure 3). In severe cases, it may result in plant death.
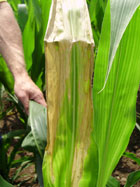
Figure 3. Symptoms of leaf scorch in corn due to drought stress. Certain biotic agents may exhibit look-alike symptoms. Source: Purdue University
Fortunately, nature has devised a clever strategy to balance photochemistry in a mutually competing process known as energy quenching. Three possibilities exist for energy quenching in the chloroplast. The first possibility is called photochemical quenching (qP), in which light energy is converted into stored chemical energy via electron transport, as shown in Figure 2. Second, some of the energy is also dissipated as heat by the PSII light-harvesting pigments, funneled through non-photosynthetic accessory pigments such as xanthophylls, or simply avoided by down-regulating PSII activity. This is known as non-photochemical quenching (NPQ). Lastly, a small but important fraction of this excess energy is emitted as fluorescence from chlorophyll molecules. This is called fluorescence quenching (qF), symbolized by the wavy line in Figure 2. Photochemical quenching occurs in competition with NPQ and qF such that an increase in the efficiency of one comes at the expense of the other. Thus, by measuring chlorophyll fluorescence, we can assess the relative efficiency of photochemistry and heat dissipation, both of which are vital to plant health. This is the underlying principle of fluorescence analysis. Note that, in Figure 2, the wavelength of fluorescence emissions is always longer than that of the absorbed wavelength. As such, fluorescence entails a broadening of the wavelength spectrum, a key factor in the detection of an otherwise tiny signal. The visible wavelengths that induce chlorophyll fluorescence can range from the blue to the red region. Blue or blue-green fluorescence is stimulated by ultraviolet light, which is not used in photosynthesis and may be ignored for our purposes.
Chlorophyll fluorescence analysis is one of the most widely used non-invasive methods for probing the state of PSII. The technique is easy, rapid, relatively low-cost, yet highly sensitive. The sensitivity of PSII to biotic and abiotic stress makes it an ideal bellwether of changes in plant genetics, pathology, and response to environmental stimuli. However, the technique remains relatively obscure outside plant physiology, nor has it gained traction in remote sensing applications in agriculture. Some of this can be explained by the challenges of unmixing the fluorescence emission signal from other upwelling radiation that overlap in the same wavelength range. Techniques such as Fraunhofer line depth detection (FLD) and laser-induced saturation pulse (LISP) are promising but remain under development. On the other hand, handheld or clip-on devices for measuring chlorophyll fluorescence in vivo, that is, actual photosynthetic activity in living plant tissue, are commonplace among researchers today. Could this powerful technology be deployed to routinely interrogate plant status in the field? What about benchmarking passive or active fluorescence imaging acquired via satellite and UAV sensors in precision farming? Or plant classification? Possibilities abound.
The discovery of chlorophyll fluorescence emission induction is credited to Hans Kautsky and A. Hirsch, who first reported the phenomenon in a brief scientific article published in 1931 (Govindjee 2004)4. The authors monitored the illumination of dark-adapted leaves and the ensuing rise and fall in fluorescence emission. Exposure to darkness was necessary to clear the excited electrons from the electron transport chain and to purge the acceptor pools. They observed traces similar to those in Figure 4.
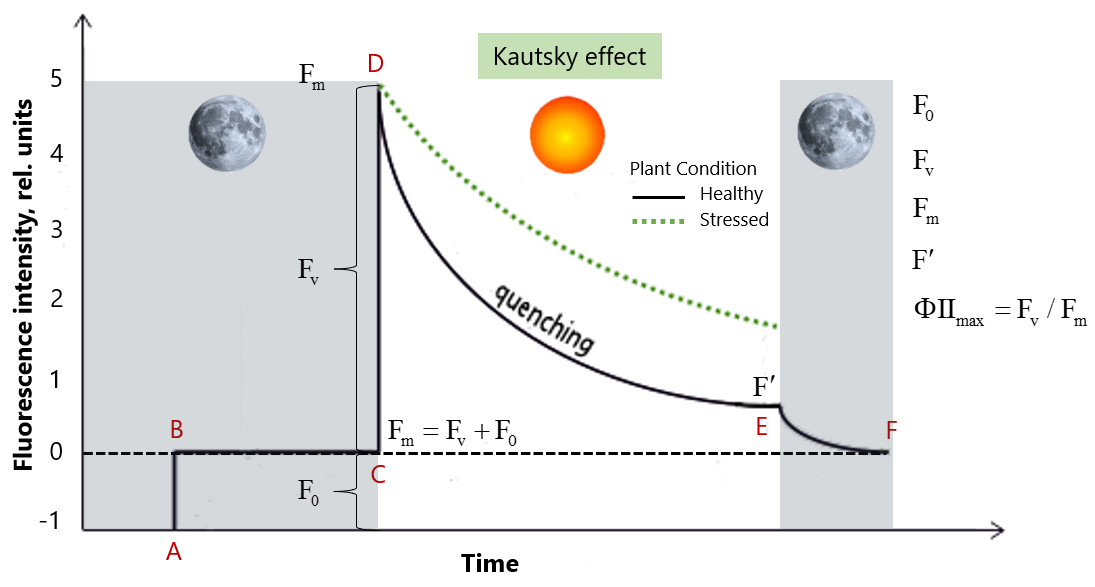
Figure 4. Typical chlorophyll fluorescence emission trace for a dark-adapted leaf made with a "Kautsky"-type fluorometer. Interpretation: A is the point illuminated by a pulse of non-saturating light; B is the chlorophyll emission when all reaction centers are open, i.e. unquenched, where NPQ = 0; C is the point illuminated by a pulse of saturating light; D is the emission peak, E is the emission approaching steady-state; F is the emission when all reaction centers have relaxed. F0 = non-electron transport-stimulating emission 'background' eliciting the minimum fluorescence value; Fm is the maximum fluorescence value; Fv is variable fluorescence = Fm – F0; F' (F-prime), steady-state fluorescence in light. If the plant is under stress, e.g., due to lack of moisture, exposure to pathogens, herbicides, or extreme temperatures, the emission trace might resemble the slowly relaxing upper green dotted line. Source: adapted and redrawn from Murchie and Lawson 2013.
In the "Kautsky" trace depicted in Figure 4, it can be noticed that emissions rise to a point F0 where all PSII reaction centers are open, i.e., qP is maximal and NPQ is minimal. Then, there is a nanosecond rise to Fm after light absorption, the point of maximum fluorescence yield. The rise to Fm occurs only when all reaction centers are closed, because fluorescence competes with photochemistry. The distance from F0 to Fm is known as "variable" fluorescence, or Fv. The distance from Fm to F' is transient, marked by a gradual decay to a steady state. This is evidence that healthy plant cells can extinguish, or "quenching" light energy, whereas stressed or damaged cells cannot. Later, Genty et al. (1989) proposed that the Fv/Fm ratio directly measures the maximum quantum efficiency of PSII photochemistry (see Baker 2008).
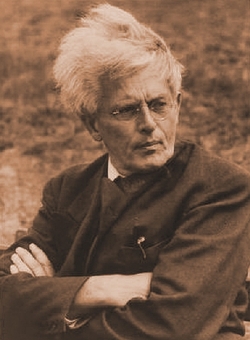
Austrian chemist Hans Kautsky (1891-1966), who is credited with discovering the "Kautsky effect" of variable rate fluorescence. Image: Wikipedia
In other words, Fv/Fm measures the maximum fraction of incident photon energy that can be used to drive PSII and electron transport. This parameter is important because it estimates the theoretical maximum quantum efficiency and therefore serves as a good indicator of CO2 fixation in photosynthesis. What, then, is the theoretical maximum quantum efficiency?
Numerous studies using Kautsky-type fluorometers have reported that, on average, Fv/Fm is approximately 0.83 under unstressed conditions (Bjorkman and Demmig 1987; Johnson et al. 1993; Genty et al. 1989). It is primarily this number that is reported as the theoretical maximum quantum efficiency of PSII photochemistry. However, normal unstressed Fv/Fm values may range from 0.77 to 0.85 across plant species. While the advent of the Kautsky fluorometer opened new paths of inquiry into photosynthesis, it suffered one serious drawback: measurements had to be made on dark-adapted leaves, necessitating bringing plants indoors or creating suitable conditions outdoors. This was impractical for measuring chlorophyll fluorescence in vivo under open field conditions in full sunlight. The problem was solved in the mid-1980s by researchers in Germany, who developed a novel fluorometer, the Pulse Amplitude Modulated (PAM) fluorometer (Schrieber et al., 1986, 2004).
The operating principle of the PAM fluorometer is similar to that of the Kautsky fluorometer, except that three distinct light sources are used. Initially, a very weak (0.1 µmol m-2 s-1) non-saturating light pulse is followed by saturating actinic5 light of moderate intensity (< 3,000 µmol m-2 s-1) used to drive photosynthesis, followed by a very high intensity saturating light up to 18,000 µmol m-2 s-1 (compare this to a maximum intensity of about 1,500 µmolm-2 s-1 at mid-latitude). The saturating light pulses overwhelm the electron acceptor pools, thereby reducing qP to zero. The difference between these peaks and the fluorescence decay trace is the quenching coefficient qN, or NPQ. This was a significant step forward, as it provided a basis for analyzing the three components of quenching: qP, qF, and NPQ, none of which could be elucidated using Kautsky fluorometers. Actively modulated light pulses, it was discovered, also provided a mechanism by which to differentiate reflectance and fluorescence signals. Figure 5 sketches out a typical leaf fluorescence response and the quantifiable parameters provided by a PAM fluorometer. You'll notice that this diagram is a modified version of the Kautsky trace in Figure 4.
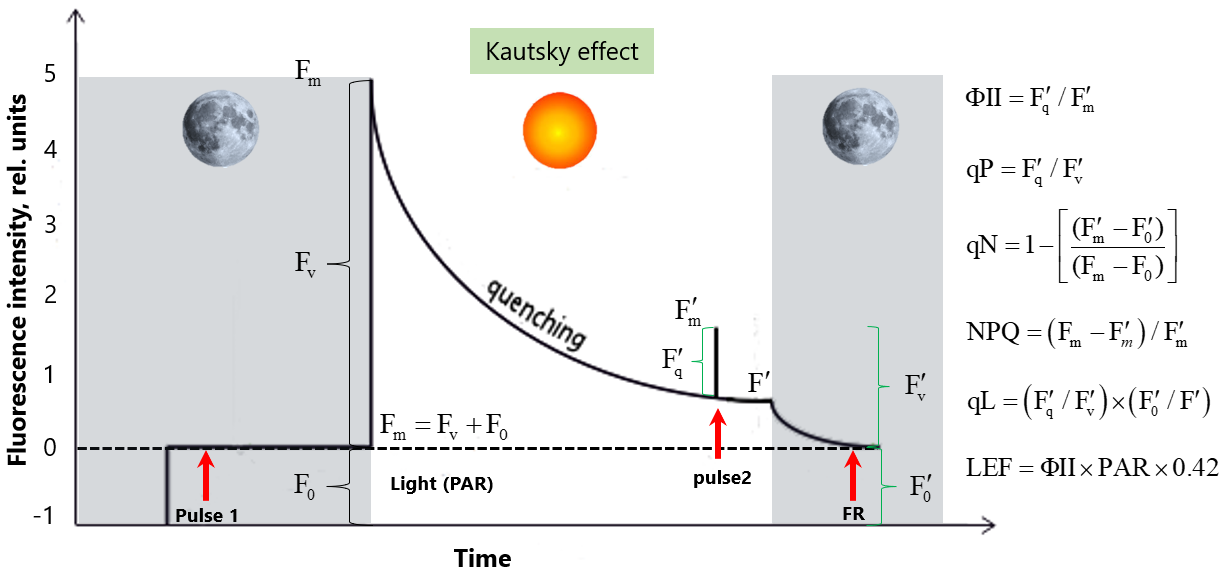
Figure 5. Typical chlorophyll fluorescence emission trace for a light-adapted leaf made with a PAM fluorometer. Interpretation: Pulse 1 = non-saturating measuring beam on; F0 = non-stimulating fluorescence emission 'background' eliciting the minimum fluorescence value; Fm is the maximum fluorescence in moderate saturating light; Fv is variable fluorescence Δ Fm – F0; Pulse 2 = high-intensity actinic light on; F' (F-prime), steady-state fluorescence; Fm' is the maximum steady-state fluorescence; Fq' is the difference between Fm' and F'; FR=pulse of far-red light to stimulate PSI; F0' is the minimum fluorescence value after switching on FR; Fv' is variable fluorescence in light Δ Fm' – F0'. Source: adapted and redrawn from Murchie and Lawson 2013.
I should point out that Figure 5 is simplified to convey the underlying principles to the reader; in practice, PAM fluorometers may emit more pulses of measuring and/or actinic light with multiple inflection points in the trace depending on the particular instrument and protocol. As previously noted, PAM fluorometers are designed to estimate PSII operational efficiency in the field under ambient light. Typically, the instrument clamps onto the leaf at a single point, as shown in Figure 6. How, then, does it take measurements in light if the leaf is obscured by the instrument head?
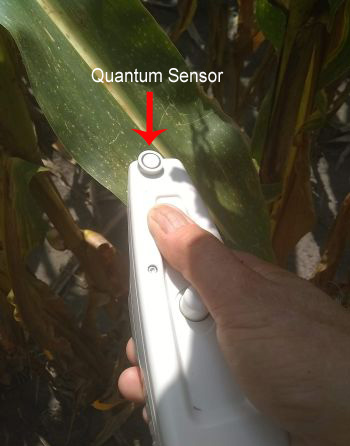
Figure 6. Hand-held PAM fluorometer with top-mounted quantum sensor.
A clever way around this has been to mount a quantum sensor on top of the instrument to measure incoming PAR intensity, typically 400 to 700 nm wavelengths. For the PAM fluorometer shown in Figure 5, ambient light intensity (µmol m-2 s-1) is reproduced within the measuring head using a series of LEDs calibrated against industry-standard quantum sensors.
The emission parameters elicited by a PAM fluorometer include ΦII, or "Phi Two", the quantum efficiency of PSII electron transport, also reported somewhat confusingly, as "operating efficiency" or "effective quantum yield" in the scientific literature. The word "quantum" is prefixed because ΦII represents the fraction of incoming photon units (quanta) driving electron transport in PSII, where most light energy is converted into food. The qP parameter represents the photon energy dissipated via electron flow in the light reaction of photosynthesis; it relates the theoretical maximum quantum efficiency Fv/Fm to the effective quantum yield, Fq'/Fm'.
Because qP is related non-linearly to the fraction of PSII centers that are open, its interpretation is not straightforward. Thus, qP is often replaced by qL, the fraction of PSII centers in the open state. The NPQ parameter, reported as "ΦNPQ" or "PhiNPQ" by some PAM fluorometers, estimates the ratio of incoming photon energy that is quenched via non-photochemical quenching6. As such, NPQ may be interpreted as regulating excess energy to reduce damage to the reaction centers in photosynthesis, i.e., a "photoprotective" device in plants. Linear electron flow (LEF), or Electron Transport Rate (ETR) per Baker 2008 is a quantity derived from other parameters as noted in Figure 5, and is interpreted as the total electron flow from the chlorophyll antenna complex, where light is captured, feeding into PSII, taking the leaf absorptivity into account. The theoretical basis for LEF rests upon several assumptions: (1) two photons are used to excite one electron; (2) the distribution of excitation between PSI and PSII is equal; and (3) a leaf absorbance coefficient of 0.84. PAM fluorometers can also measure Fv'/Fm', maximum quantum efficiency a là Kautsky, in the light. In fact, PAM fluorometers can measure a range of fractional parameters, depending on the operator's needs. Interested readers should consult Baker (2008) and Tietz et al. (2017) for a comprehensive set of emission parameters, including their formulas and definitions.
The MultispeQ is a low-cost, open-source leaf fluorometer developed by researchers at Michigan State University and marketed through PhotosynQ. The MultispeQ is designed to measure ΦPSII, the operating efficiency or effective quantum yield of PSII electron transport, along with a suite of additional parameters. In the next round, I'll share some intriguing maize plant emission data we collected with the MultispeQ PAM fluorometer in 2018, to whet your appetite.
I want to pause here to note that the information in Figures 4 and 5, including my notation and interpretation, is based primarily on two sources: Murchie and Lawson (2013) and Baker (2008). Any novice (remembering that we were all once novices) wading into the vast literature on chlorophyll fluorescence emission is confronted by a strange, if not befuddling, array of notation and nomenclature. Worse yet, this notation is prone to change from one source to another, making it difficult for the beginner to parse, let alone comprehend, its meaning. Baker 2008 attempted to bring some order to this unholy mess, but the result is that it's still challenging. With this in mind, I'll caution the reader that this is my best interpretation of the details of fluorescence emission from the two sources above, along with a few others, such as Maxwell and Johnson (2000), Kalaji et al. (2017), and Govindjee (2004). The saying, "Oh, what a tangled web we weave," attributed to Sir Walter Scott, applies here. Saying that, if the reader should detect errors or ambiguities in anything that I've written, please reach out to me via email. This is a blog, not a peer-reviewed article.
Following the principle that strong pedagogy is best administered in homeopathic doses, I conclude this brief foray into the captivating field of plant fluorescence. It's been some time in the works, so it feels good to finally push it out. Don't worry, there's more! In the next round, I'll share some intriguing maize plant emission data we collected with the MultispeQ PAM fluorometer in 2018, to whet your appetite.
In the meantime, shower your plants with gentle husbandry. You never know what you might hear back.
End Notes
1 Integrating Planck's Law of blackbody radiation between 400 and 700 nm yields a fractional PAR value of 0.368 outside Earth's atmosphere. Higher PAR fractions are typically measured at Earth's surface, owing in part to selective filtering of the solar spectrum by the atmosphere through absorption and scattering.
2 Figure 1 is somewhat misleading in that it shows green light reflected only off the upper cuticle of the leaf. In reality, there are two leaf reflection components: one arising from the reflection of full-spectrum incident light off the leaf's upper cuticle, and one from inside the leaf that has been depleted in the non-green visible wavelengths. The latter comprises a mixture of reflection and scattering off internal leaf components and helps to explain the green color of leaves.
3 The light reaction supplies both electrons (e–) and protons (H+). Protons are generated from the splitting of water molecules in PSII as shown in Figure 2. Electron transport in PSII generates a build-up of protons inside the membranes of the chloroplast, which drives the formation of the energy-supplying molecule ATP. Here, we focus solely on electron transport in the light reaction.
4 Kautsky wasn't the first to observe the phenomenon of fluorescence. Sirs David Brewster and John Herschel made visual observations in the 19th century but it was left to Kautsky and Hirsch to interpret the rise and fall of the fluorescence trace in terms of photochemistry.
5 Visible light that is absorbed by the chlorophyll antenna and will drive electron transport. Blue and red light are examples.
6 A related parameter NPQT may also be calculated. See Tietz et al. 2017 for its definition and interpretation vis à vis NPQ.
Further Diggings
Baker, N.R., 2008. Chlorophyll fluorescence: A probe of photosynthesis in vivo. Annual Review of Plant Biology. 59, 89–113. https://doi.org/10.1146/annurev.arplant.59.032607.092759
Bisio, G., and A. Bisio. 1998. Some thermodynamic remarks on photosynthetic energy conversion. Energy Conversion and Management 39, 741–748. https://doi.org/10.1016/S0196-8904(97)10042-5
Björkman, O., and B. Demmig. 1987. Photon yield of O2 evolution and chlorophyll fluorescence characteristics at 77 K among vascular plants of diverse origins. Planta 170, 489–504. https://doi.org/10.1007/BF00402983
Davidson, M., Berger, M., Moya, I., Moreno, J., Laurila, T., Stoll, M., and J. Miller. 2003. Mapping photosynthesis from space – a new vegetation-fluorescence technique. ESA Bulletin No. 116, p. 34–37. http://www.esa.int/esapub/bulletin/bullet116/chapter4_bul116.pdf
Genty, B., Briantais, J.M., and N.R. Baker. 1989. The relationship between the quantum yield of photosynthetic electron transport and quenching of chlorophyll fluorescence. Biochimica et Biophysica Acta – General Subjects 990, 87–92. https://doi.org/10.1016/S0304-4165(89)80016-9
Goudriaan, J., 2016. Light Distribution. In: Hikosaka, K., Niinemets, Ü., and N.P.R. Anten (Eds.), Canopy Photosynthesis: From Basics to Applications. Springer Netherlands, Dordrecht, pp. 3–22. https://doi.org/10.1007/978-94-017-7291-4_1
Govindjee, G., 2004. Chlorophyll a fluorescence: a bit of basics and history. In: Papageorgiou, G.C., and G. Govindjee (Eds.), Chlorophyll a Fluorescence: a Signature of Photosynthesis. Springer, Dordrecht pp. 1–42. https://doi.org:10.1007/978-1-4020-3218-9
Howell, T.A., Meek, D.W., and J.L. Hatfield. 1983. Relationship of photosynthetically active radiation to shortwave radiation in the San Joaquin Valley. Agricultural Meteorology 28, 157–175. https://doi.org/10.1016/0002-1571(83)90005-5
Jacovides, C.P., Tymvios, F.S., Asimakopoulos, D.N., Theofilou, K.M., and S. Pashiardes. 2003. Global photosynthetically active radiation and its relationship with global solar radiation in the Eastern Mediterranean basin. Theoretical and Applied Climatology 74, 227–233. https://doi.org/10.1007/s00704-002-0685-5
Johnson, G., Young, A. Scholes, J., and P. Horton. 1993. The dissipation of excess excitation energy in British plant species. Plant, Cell & Environment 16, 673–679. https://doi.org/10.1111/j.1365-3040.1993.tb00485.x
Kalaji, M.H., Goltsev, V., Zuk-Golaszewska, K.Z., Zivcak, M., and M. Brestic. 2017. Chlorophyll Fluorescence: Understanding Crop Performance — Basics and Applications. Boca Raton, FL: CRC Press.
Maxwell, K., and G.N. Johnson. 2000. Chlorophyll fluorescence — a practical guide. Journal of Experimental Botany 51, 659–668. https://doi.org/10.1093/jexbot/51.345.659
Murchie, E.H., and T. Lawson. 2013. Chlorophyll fluorescence analysis: a guide to good practice and understanding some new applications. Journal of Experimental Botany 64, 3983–3998. https://doi.org/10.1093/jxb/ert208
Nobel, P.S. 2004. Physicochemical & environmental plant physiology. Boston: Elsevier.
Schreiber, U. 2004. Pulse-amplitude-modulation (PAM) fluorometry and saturation pulse method: An overview. In: Papageorgiou, G.C., Govindjee (Eds.), Chlorophyll a Fluorescence: A Signature of Photosynthesis. Springer Netherlands, Dordrecht, pp. 279–319. https://doi.org/10.1007/978-1-4020-3218-9_11
Schreiber, U., Schliwa, U., and W. Bilger. 1986. Continuous recording of photochemical and non-photochemical chlorophyll fluorescence quenching with a new type of modulation fluorometer. Photosynthesis Research 10, 51–62. https://doi.org/10.1007/BF00024185
Tietz, S., Hall, C.C., Cruz, J.A., and D.M. Kramer. 2017. NPQ(T): a chlorophyll fluorescence parameter for rapid estimation and imaging of non-photochemical quenching of excitons in photosystem-II-associated antenna complexes. Plant, Cell & Environment 40, 1243–1255. https://doi.org/10.1111/pce.12924
Disclaimer: Links to digital content in this blog are for the reader's information only, not an endorsement of that content.