Further Notes on Climate “Smart” Agriculture: Carbon Sequestration and its Discontents
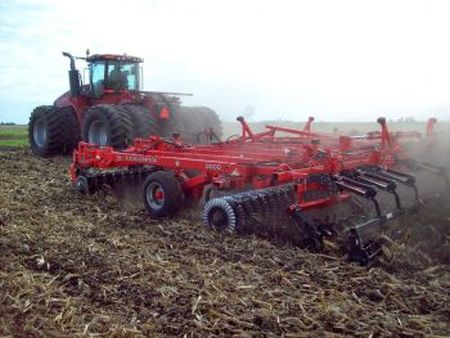
Climate "smart" enthusiasts claim that the damaging effects of climate change can be reversed by agricultural practices that promote the sequestration of atmospheric carbon in the soil. What is the evidence?
In my February 7, 2017, palaver, “Climate ‘Smart’ or Climate Semantics?”, I gave an unflattering review of climate-smart agriculture (CSA), now in heavy rotation by international donors USAID, FAO, The World Bank, and research centers like CGIAR. Since then, it has been covered by Crops, Soils, and Agronomy News magazine, a monthly review published jointly by the Crop Science, Soil Science, and Agronomy Societies of America. Nothing I have read there changed my view of CSA.
Central to the climate-smart push is the “triple win”: the idea that adopting CSA enables farm operators to simultaneously boost productivity, manage risk, and mitigate climate change, all in one nifty, if rebooted, package of “sustainable” know-how. The mitigation potential of CSA primarily rests on the efficient capture and storage of atmospheric CO2 in soil organic matter, a process known as carbon sequestration. I should point out that carbon sequestration is not the same as soil organic matter, which is different from soil organic carbon.
The gilded words “carbon sequestration” have burnished brightly in global climate change circles. In the context of mitigation, carbon sequestration refers to the process of removing CO2 from the atmosphere and storing it in one of four major “pools”: oceanic, geologic, biotic, and soil. Organic matter is the foremost repository of carbon in non-arid soils, and the final product of decayed, once-living biomass. Regardless of whether plant or animal, all living biomass is directly or indirectly the product of carbon transfers from the atmosphere via photosynthesis. Cropping systems that favor soil organic matter accumulation include reduced- or zero-tillage, cropping intensification, and permanent or semi-permanent soil cover (mulching) with plant residue. Collectively, such techniques are known as conservation agriculture (CA), whereas conservation tillage (CT) emphasizes reduced tillage and concomitant soil cover.
Curiously, time scale is rarely mentioned in the annals of carbon sequestration. Is carbon fixed in soil organic matter for one year, “sequestered” by global climate change models? Would this be considered “successful” mitigation for CSA accounting purposes? What about a decade or a century? For example, soil organic carbon is often divided into two fractions: “labile” and “stable” based on their residence time in the soil. For the labile fraction, which consists of surficial or buried plant litter and particulate organic matter, decomposition occurs over a timescale of days to years. Humus and resistant products, such as charcoal and biochar, in contrast, decompose over years to decades. What’s a climate-smart operator to do?
In the real world, farmers adjust soil and crop management practices in response to changing markets, commodity prices, pest control efforts, and other agronomic factors. Such changes may be neutral, carbon-negative, or result in a net transfer of CO2 back to the atmosphere (carbon-positive). The point is: Decisions regarding tillage, pests, fertilization, harvest, and post-harvest handling may change from year to year depending on circumstances. Carbon that was sequestered in the farmer’s fields last year, or the year before, may suddenly “gas off” to the atmosphere when tilling the land for any number of valid agronomic reasons: disease and insect pest control, precision land leveling for irrigation and drainage, and smoothing out ruts. Suffice it to say, the terrestrial carbon cycle is not a simple input/output device, like some hard drive container manipulated by pushing buttons. It is a grave misunderstanding to treat it as such; however, I leave the temporal ambiguity surrounding soil carbon sequestration unresolved for now.
A key point in the climate-smart debate is how to evaluate CA’s performance in reducing greenhouse gas (GHG) emissions, particularly CO2. In that vein, several pertinent questions call out: How much carbon is sequestered in the soil under conservation tillage compared with conventional plow tillage? Is carbon sequestration in the soil predictable? Are carbon sequestration rates high enough to offset global CO2 emissions from fossil fuels in a manner that would put the brakes on climate change? What follows is a deliberate, somewhat esoteric vetting of claims and counterclaims, framed against experimental data from numerous well-characterized research plots, including long-term tillage plots maintained by North Carolina State University. The esoteric part refers to units of measurement that are not commonly encountered in daily life, even for those well-versed in the metric system. Hang in there, though. The Internet is at your fingertips; feel free to use it. See also my End Notes for more help.
First, we need an idea of how much carbon must be sequestered and the time required to complete the task. Here, we’ll follow the Intergovernmental Panel on Climate Change (IPCC) 2007 guidance that, to limit global temperature rise since the industrial revolution to 2 degrees Celsius (°C), considered a prudent limit to avoid dangerous interference with the climate system, CO2 emissions must be cut to 15% of the year 2000 levels. This target may seem rather drastic, even unattainable, but it provides a valuable benchmark for calculating how much carbon must be sequestered. Regardless, a further 0.5 degrees C increase may be “baked in the cake” due to the thermal inertia of the oceans even if GHG emissions were eliminated today (see “B1” scenario in Meehl et al. 2007). So, the task of stabilizing the Earth’s temperature is not simply a matter of reducing and/or removing GHGs. Still, the 2-degree limit has been adopted by more than 100 countries (IPCC, 2007), so it’s not just some arbitrary figure.
Global carbon emissions in 2000 were approximately 6.3 Gt C (World Bank, 2004). Thus, a reduction to 15% would set the limit at 0.9 Gt C per year. By contrast, the estimated anthropogenic (=from human activity) carbon footprint in 2015 was 35.5 Gt CO2 (Quéré et al., 2016), or 9.7 Gt C, so we are forging ahead quite bravely on the emissions front2. Even so, that figure could surge to 58 Gt CO2 yr-1 (15.8 Gt C yr-1) by 2050 without measures in place to reduce GHG emissions (IEA, 2016). In this scenario, potential cumulative GHG emissions from 2000 to 2049 could reach 2,000 Gt CO2 (546 Gt C). The task before us is daunting, without question.
That being said, the task is not beyond human reach. The pertinent question is: What is agriculture’s “climate-smart” potential for mitigating GHG emissions?
Let’s begin by examining claims from the United Nations Environment Program (UNEP) Emission Gap Report 2013. The report contends that direct GHG emissions from agriculture could be reduced by 1.1 to 4.3 Gt CO2e yr-1 by 2020, with 89% of this potential realized through improved management practices, including conversion to no-tillage cropping, more efficient fertilizer use, and the addition of biochar to soil. Here, I focus on the first item in the list: improved management via no-tillage and reduced-tillage cropping. I don’t mean to discount the more efficient use of fertilizers, which would undoubtedly curb GHG emissions more than tillage. However, I do not have any data on this, nor am I familiar with the methodology for evaluating such a claim. As for adding biochar to the soil, this is not happening, and is unlikely ever to happen, on a large enough scale to make a difference in GHG emissions. Industrial-scale biochar production is complex and costly, while the availability of potential feedstock (organic debris) is severely limited by competition for feed, fuel, and soil cover, among other factors. It’s moot, in my opinion.
Back in 2014, David S. Powlson, along with a group of leading scientists, published an article titled “Limited potential of no-till agriculture for climate change mitigation”, which cast doubt on the UNEP Emission Gap Report 2013’s claims. They argued that emission reductions of 1.1 to 4.3 Gt CO2e yr-1 by 2020 were over-optimistic. Powlson’s group calculated that the most realistic no-tillage scenario was 0.6 Gt CO2e yr-1, applying an average sequestration rate of 0.3 t C ha-1 yr-1 based on a global cereal crops area of 559 million hectares. Limiting their calculation to the remaining corn, rice, and wheat cropping areas reduced the sequestration rate to 0.4 Gt CO2e yr-1. Even the 0.4 Gt CO2e yr-1 figure, they contend, is rosy.
It turns out that we can test the Powlson and UNEP claims using soil carbon data from North Carolina State University’s long-term agronomy plots at Reidsville. These plots have been maintained in continuous corn or corn-soybean rotation since 1984, providing a unique platform for evaluating the effects of land management on soil properties and crop responses in the southern Piedmont and similar environments worldwide. Briefly, the Reidsville plots comprise nine tillage treatments varying in timing and intensity: fall or spring moldboard plowing, fall or spring chisel plowing with or without disking, spring disking only, no-tillage, and no-tillage with shallow under-row subsoiling. Here, we focus on soil and crop data from four tillage plots: no-tillage, spring disk, spring chisel plow, and spring moldboard plow + disk tillage. These four technologies have consistently shown year-to-year differences in grain yield.
Back in 2007, under the auspices of North Carolina’s Corn Growers Association, I measured soil carbon (among other properties) in the Reidsville plots to a depth of 30 cm (12 inches), in 10 cm increments, 23 years after they were established. Twenty years is the span adopted by IPCC (2006) for assessing carbon retention in soil, so our sampling may be considered well aligned with that benchmark, if not perfect. Sampling was limited to 30 cm because this is the maximum working depth of the tillage tools. One could argue that some roots, particularly corn, extend deeper than 30 cm. However, beneath 30 cm, the environment for root extension becomes increasingly hostile (read more about this later). As such, the top 30 cm of the soil is considered the prime soil-plant-tillage interaction zone, “the staging ground” where the action is. In addition, soil dry (bulk) density was measured in the same plots at 10 cm increments. Dry density is needed to calculate soil carbon stocks on a mass-per-unit-area basis, an essential piece of information for estimating changes in carbon over time.
Unfortunately, soil carbon was not measured before establishing the plots, so the pre-1984 30-cm carbon stock has been set equal to that of conventional moldboard plow tillage, i.e., the “reference” or “baseline” soil. This is justified because moldboard plow tillage was widely practiced across similar soil-climatic conditions in the southern U.S. Piedmont before the advent of no-tillage planting technology. It also aligns with the method applied by Aguilera et al. in their 2013 meta-analysis testing long-term soil carbon sequestration in Mediterranean cropping systems. Here, too, I have applied Aguilera’s formula for calculating the carbon sequestration rate in the Reidsville plots. The soil data were compiled and analyzed using Analysis of Variance (ANOVA) procedures in SAS 9.4.
Results from the 2006 campaign at Reidsville are summarized in the chart panels below.
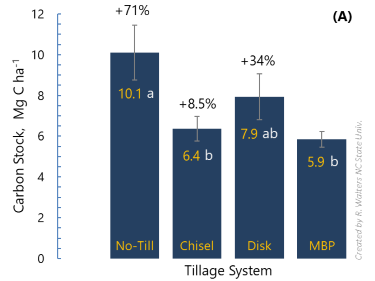
Mean carbon stock under four tillage systems 0-30 cm deep. Change in carbon stock (+) was calculated as the percentage increase relative to the moldboard plow (MBP) tillage treatment, over 23 years. Means followed by the same lower-case letter are not different at the 95% probability level. Vertical gray lines are the standard error of the mean (n=12). Mass units are metric tons (1,000 kg).
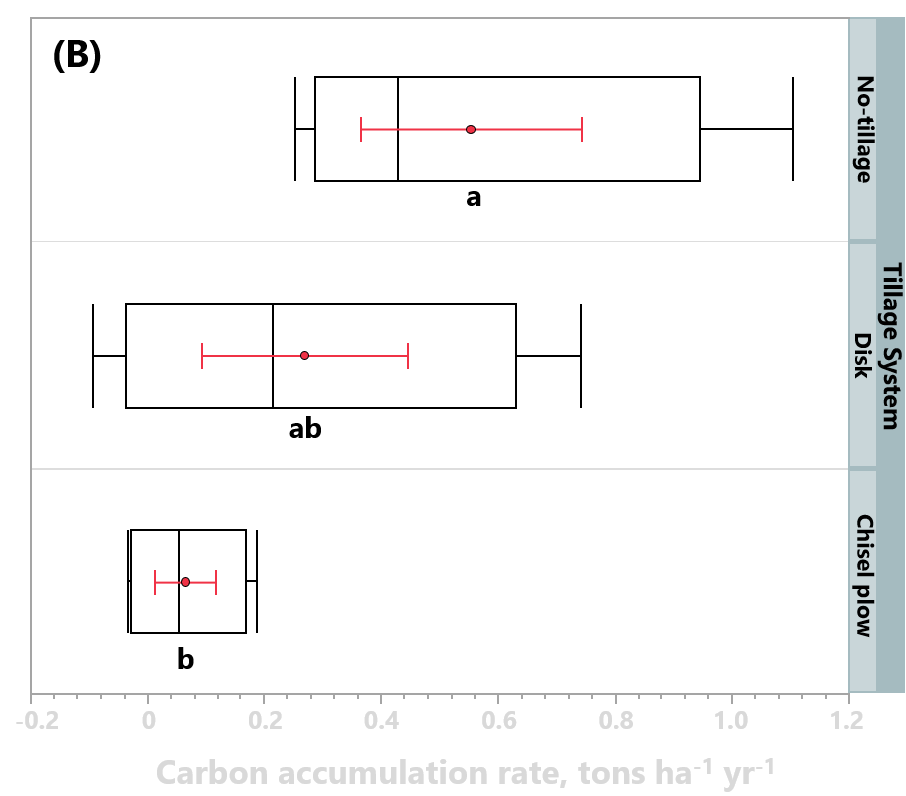
Temporal change in carbon accumulation rate, UPRS North Carolina USA.
Panel (A) shows that soil carbon stocks under no-tillage increased by 71% compared with conventional moldboard plow tillage. Chisel plow tillage, consisting of spring-loaded shanks mounted 30 cm apart on the toolbar (Figure C), accumulated only 8.5% more carbon compared with moldboard plow tillage, a relatively poor performance given that chisel plows are “non-inversion”, meaning they do not bury surface residues in the same manner as disk and moldboard plows. Disk tillage accumulated a solid 34%.
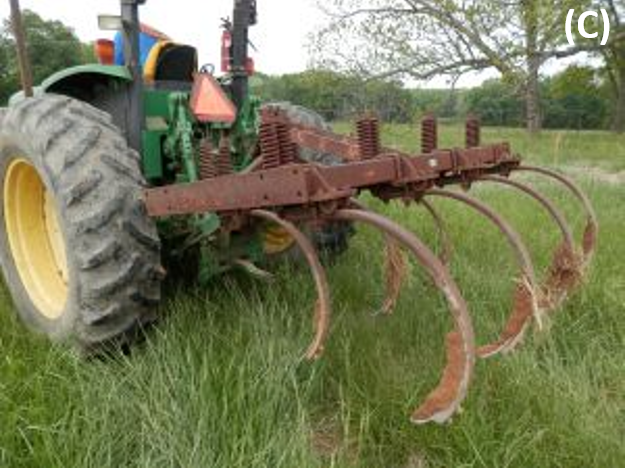
Figure C. Chisel plow with spring-loaded shanks.
Panel (B) portrays the information we are really after: change in soil carbon accumulation over time, i.e., the carbon “sequestration” rate. This is known as a “box and whisker” plot by statistics and data science gurus. The solid red circles inside the black interquartile boxes mark the average annual soil carbon accumulation, scaled on the x-axis. Moldboard plow tillage is missing from Panel (B) because its soil carbon profile is used as the reference for calculating the other three tillage systems, according to Aguilera et al. 2013. Red horizontal lines are the standard error of the mean, a quantitative measure of precision in the mean value conditioned on the number of observations3. Box and whisker plots are more informative than just the mean value because they provide the distribution of “observed” values that make up the mean. Note that differences in carbon accumulation rate were only detected at the less restrictive 90% probability level.
What information about carbon sequestration do the Reidsville plots reveal?
First, on average, annual carbon accumulation in no-tillage was 0.55 t C ha-1 yr-1, compared with 0.27 and 0.07 t C ha-1 yr-1 for disk and chisel plow tillage, respectively. Thus, on average, our no-tillage outperformed Franzluebbers’ (2010) 0.45 t C ha-1 yr-1 multi-site conservation tillage estimate for the southeastern United States and performed considerably better than 0.3-0.4 t C ha-1 yr-1 reported by Aguilera et al. for the Mediterranean cropping systems. Incidentally, the Aguilera rates were used by Powlson et al. in their calculations and generally align with measurements from other soil and climatic regions (Sanderman et al., 2010; VandenBygaart et al., 2003). Applying a global cereal crop area of 559 million hectares (as per Powlson et al., 2014), the soil under no-tillage at Reidsville would accumulate, annually, 0.31 Gt C, equivalent to 1.04 Gt CO2e yr-1. This estimate falls short of the UNEP 2013 emissions-reduction target, but not by much.
Second, the box-and-whisker plots indicate a high cross-plot variance in soil organic carbon accumulation within a uniform soil mapping unit (Wedowee sandy loam) of less than 1 hectare (2.47 acres). For example, the standard error for disk tillage in Panel (B) is ±0.18 t C ha-1 yr-1, which is 67% of its mean value. The situation for the chisel plow is even worse: its standard error is ±0.05 t C ha-1 yr-1, about equal to its mean! Furthermore, the coefficient of variation (CV), a relative statistical measure of precision, was 68% for no-tillage and 159% and 131% for chisel and disk plow tillage, respectively. Several disk-and-chisel plow tillage plots showed negative rates of soil carbon accumulation. As such, the data are inadequate predictors of carbon sequestration at Reidsville, let alone at other locations with different soils, crops, cropping rotations, and management practices. Given that tillage plots are cropped across a ~5% slope (Figures D and E), we infer that redistribution of crop residue and particulate organic matter has occurred over the years (simulations measuring runoff and sediment deposition have been conducted in these plots, indicating that this is indeed the case). This could explain some of the plot-to-plot variation in carbon stocks.
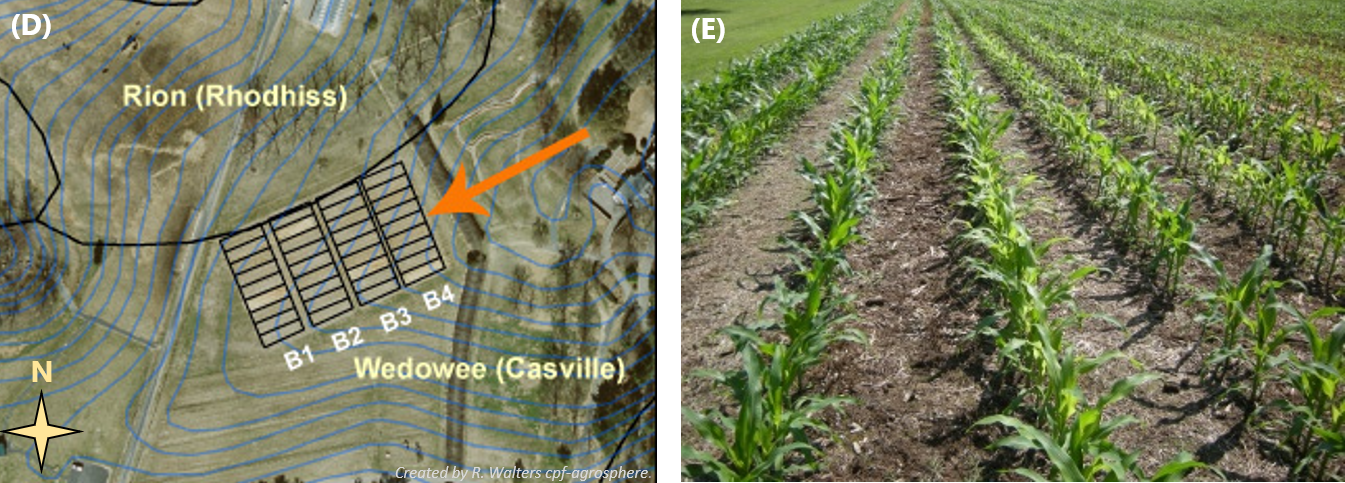
Figure D: Aerial view of long-term agronomy plots at the Upper Piedmont Research Station, Reidsville, North Carolina, showing 0.61 m contours (blue lines) and soil map units. The site has a sloping topography (~5%) typical of the southern Piedmont region. Replicate blocks (B1...B4) are oriented NW-SE across the contour. Soil type: Wedowee (Casville) sandy loam. Figure E: Long-term agronomy plots at the Reidsville site. Foreground: no-till planted corn. These plots have been in continuous corn, or corn-soybean rotation, since 1984 with controlled traffic.
Nonetheless, sloping topography is a common feature of the southern Piedmont, even into the upper Coastal Plain. We should, therefore, expect to find variations in soil carbon accumulation at least as great, if not greater than, those measured at Reidsville. On the other hand, in one of the longest-running, well-characterized tillage trials located in northern France (Dimassi et al. 2014), there has been, astonishingly, no increase in soil organic carbon under no-tillage after 41 years! Similar findings were reported by Loke et al. (2012) in wheat in South Africa and by Young et al. (2009) in long-fallow and continuous cereal cropping in Australia. No wonder, then, that Dimassi et al. conclude, “there is still no consensus on the importance of sequestration which can be expected from reduced tillage”. I would concur.
Baker et al. (2007) make the point in their paper, “Tillage and soil carbon sequestration – What do we really know?,” that where sampling has gone below 30 cm deep in conservation tillage, no consistent accumulation of soil organic carbon has been observed. What is happening, they claim, is redistribution of carbon through the soil profile, with more carbon accruing deeper in the profile under conventional plow tillage and higher concentrations near the surface under no-tillage. Luo et al. (2010) reached similar conclusions by sampling down to a depth of 40 cm. Soil mixing and root extension were cited as reasons for the apparent carbon redistribution.
Lastly, and by way of “proof in the pudding”, Reidsville corn grain yields are shown below in Panel (F).
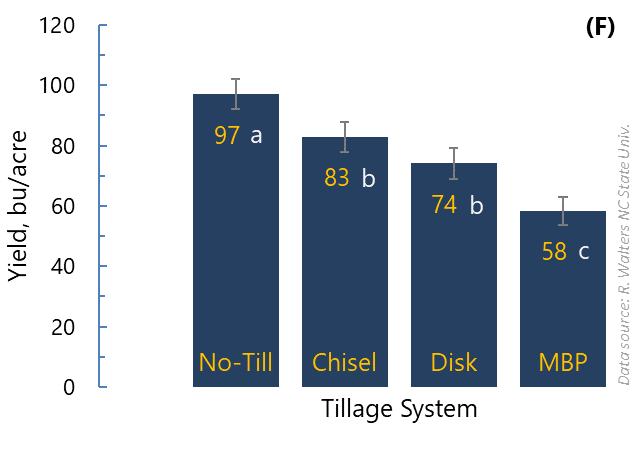
Mean corn grain yield by four tillage systems, 1987-2013. Means followed by the same lowercase letter are not significantly different at the 95% confidence level. Vertical gray lines are the standard error of the mean (n=104). Bushels per acre @15.5% moisture. MBP=moldboard plow.
Here, no-tillage has outperformed chisel, disk, and moldboard plow tillage, hands down. The resilient nature of chisel plow tillage is also interesting, given the chisel’s low soil carbon status and negligible 23-year carbon accumulation rate. This seems to contradict the notion, popular among soil health and CSA enthusiasts, that soil carbon is the prime factor—the linchpin, if you will—driving terrestrial ecosystem productivity. The Reidsville tillage plots beseech otherwise. Productivity metrics, such as grain yield and total biomass, are likely related to differences in infiltration following precipitation and to the conservation of soil moisture within the soil profile through residue cover (i.e., once-living plant mulch).
We monitored the profile (1 m) soil water content in the tillage plots over several years, and measured the percentage of residue cover at multiple time points. We found that in-season profile water content, tillage intensity, and residue cover were strongly related to grain yield and total biomass. The high land surface roughness resulting from chisel plowing has helped concentrate precipitation, allowing it to infiltrate more effectively. It’s fair to question, therefore, whether carbon accumulation is the prime factor driving agro-productivity in southern Piedmont mineral soils under conservation tillage. In fact, carbon as a rooting media constituent is not needed at all for plant production (hydro-, aero-, and aquaponic systems certainly serve as proof of concept); rainforests have the highest net primary productivity of all terrestrial ecosystems, whereas the soil beneath them stores very little carbon. To my knowledge, no “optimal” level of carbon content has been established for any soil, anywhere. This should not be taken as a dismissal of the value of soil carbon. Soil carbon and infiltration are closely related in many soils. However, the facts argue for a more nuanced view of soil carbon than the soil health and CSA crowd advocates would have it. Plants and whole ecosystems can thrive across a wide range of soil carbon levels.
A final word about corn grain yields in Panel (F), because inevitably someone will point this out: Why are they so low? There are two principal reasons.
First, about two-thirds of the mapped soils across North Carolina’s Piedmont are eroded “Typic Kanhapludults”, the name soil scientists have given old, weathered mineral soils with strongly developed horizons (horizons are layers, as in a cake). Soil series such as Cecil, Pacolet, Rion, Vance, and Madison cover millions of upland acres throughout the region. The Typic Kanhapludults have sandy to sandy clay loam surface horizons (the “A” horizon or “Ap” if under cultivation to about 8 inches deep) over loamy- to clayey-textured subsoil (the “B” horizon). Unlike Midwest prairie soil developed beneath sod (“Mollisols”), the Typic Kanhapludults are not endowed with high nutrient and water-holding capacity. Micronutrient supplies are often low; thus, to prevent deficiencies, we adjust the soil pH to ~6.0, which is considered slightly acidic. Root extension is usually limited by subsoil acidity and shallow dense saprolite (decomposed rock).
Second, the Reidsville plots are “rainfed,” i.e., without supplemental irrigation. Cumulative rainfall during the critical period for corn and soybeans in North Carolina usually lags well below crop evapotranspiration. While average corn and soybean grain yields at Reidsville have climbed over the years, stress from short-term summer droughts is common during the critical stages of crop development. A few years have seen bumper crops, while most have been mediocre, and a few disastrous. The result is that corn and soybean grain yields at Reidsville are, on average, lower than state and U.S. averages: 129 bu/acre in North Carolina and 174.6 bu/acre nationally across all production categories in 2016. Still, the long-term trend is irrefutable: conservation tillage practices have sustained higher corn yields in the southern Piedmont despite irregular rainfall and variable soil carbon accumulation, which is either negative or relatively low.
In summary, and returning to the pivotal question: How much carbon is sequestered in the soil under conservation tillage compared with conventional plow tillage? The answer from Reidsville is 0.31 Gt C annually, equivalent to 1.04 Gt CO2e yr-1 on a global cropping area basis. The wide interquartile ranges in the box-and-whisker plots in Panel (B) suggest the inherent unpredictability of carbon sequestration across three representative tillage planting systems. In some cases, experimental data have shown no net carbon accumulation in the profile. In contrast, gains, on average, of ~0.45 t C ha-1 yr-1 were reported by Franzluebbers for the southeastern U.S. and ~0.57 t C ha-1 yr-1 reported by West and Post (2002) worldwide. Shallow sampling depths (<30 cm) in many studies have hindered an unbiased, accurate portrayal of soil carbon cycles and associated sequestration.
What about climate change mitigation? Are carbon sequestration rates associated with conservation tillage practices high enough to offset global CO2 emissions from fossil fuels in a manner that would slow down climate change? Again, we are forced to ponder the magnitude of the problem: CO2 emissions in 2015 were 35.5 Gt (billions of metric tons), a figure that must be cut to 0.9 Gt C per year (15% of the year 2000 emissions) to limit global temperature rise above a pre-industrial 2 degrees Celsius. Cumulative GHG emissions could reach 2,000 Gt CO2 by 2100. In contrast, the Reidsville plots suggest that, in a best-case scenario, 1.04 Gt CO2e yr-1 could be sequestered by no-tillage using the global cereal crop area of 559 million hectares, as applied by Powlson et al. (2014).
The Reidsville no-tillage rate is invariably over-optimistic due to the limitations for “across the board” land conversions, annual cropping cycle changes, and consequently, changes in land management by operators; spatially variable carbon sequestration rates; limited saturation potential in coarse-textured, e.g. sandy, soil (Hassink, 1997; Chen et al. 2019); misunderstanding of carbon flows in terrestrial ecosystems and, the potential for elevated CO2 emissions from increasing plant and soil microbial respiration as the temperature rises. Carbon sequestration in biomass and the soil is a naturally occurring process and the most practical, cost-effective solution. However, the annual sequestration potential of conservation agriculture is small relative to global CO2 emissions.
Where does this position CSA? I would argue that the impact of CSA practices on climate change is minuscule. That doesn’t mean conservation agriculture and soil- and water-conserving tillage practices should not be implemented. They should be implemented for reasons of operational efficiency, cost savings, and productivity, not for climate change mitigation.
In the meantime, I’ll stick with the time-tested, CSA-free blueprint for agronomic progress and global food security: developing stable, stress-tolerant germplasm adapted to local environments, improved water and fertilizer management, post-harvest technology, and infrastructure for delivering seed, pest control, irrigation, fertilizer, and timely information to farmers regardless of what climate change brings.
If we sequester some carbon along the way, all the better.
End Notes
1 Greenhouse gases involved in carbon sequestration are expressed herein in two different ways: (1) “carbon dioxide equivalent per unit time”, written as “CO2e yr-1” (read: “carbon dioxide equivalent per year”), the negative exponent is a mathematical notation for the reciprocal, i.e. 1/yr; and (2) mass of elemental carbon (C) per unit area and/or unit time, written as “Gt C ha-1 yr-1 [read: “gigatons (one billion metric tons) per hectare per year”] or “t C ha-1 yr-1” [read: metric tons (1,000 kg) per hectare per year]. A hectare is a metric unit of area = 10,000 m2, or 2.47 acres. The conversion from elemental carbon (C) units to carbon dioxide equivalent (CO2e) is given by: C x 3.66 = CO2e. This is based on the ratio of the molecular weight of carbon dioxide to one atom of elemental carbon: 44/12. Thus, each kilogram (symbol: kg) of elemental carbon equals 44/12 = 3.66 kg CO2 equivalent. Conversely, each kg of CO2-equivalent contains 12/44, or 0.27 kg C. In all cases, I use the “pure” CO2e equivalent, where no other GHGs are bundled in the expression. The reader should, however, know that CO2e figures encountered elsewhere may force mixtures of methane, nitrous oxide, and hydrofluorocarbons, among others, into calculations expressed interchangeably as a common unit CO2e or CO2eq.
2 The estimate from Quéré et al. 2016 was 41.9 ± 2.8 Gt CO2. As of January 2020, the same linked source, Global Carbon Project, says 35.5 Gt CO2 so my text has been updated to agree with this figure. I don’t know where the CGP sources its data from, but the reader should keep in mind that all “global” estimates, regardless of source, are subject to error.
3 The rule of thumb is that if two SEM error bars overlap, you know that the P-value is larger than the critical value and the two means are not different. The opposite rule does not apply. With the standard deviation, no conclusion can be made if the bars overlap or don’t overlap.
Further Diggings
Aguilera, E., L. Lassaletta, A. Gattinger, and B.S. Gimeno. 2013. Managing soil carbon for climate change mitigation and adaptation in Mediterranean cropping systems: A meta-analysis. Agriculture, Ecosystems & Environment 168: 25–36.
Amelung, W., D. Bossio, W. de Vries, I. Kögel-Knabner, J. Lehmann, R. Amundson, R. Bol, C. Collins, R. Lal, B. Leifeld, B. Minasny, G. Pan, K. Paustian, C. Rumpel, J. Sanderman, J.W. van Groenigen, S. Mooney, S. van Wesemael, M. Wander, and X. Chabbi. 2020. Towards a global-scale soil climate mitigation strategy. Nature Communications 11: 5427.
Baker, J.M., T.E. Ochsner, R.T. Venterea, and T.J. Griffis. 2007. Tillage and soil carbon sequestration—What do we really know? Agriculture, Ecosystems & Environment 118 (1–4): 1–5.
Baveye, P.C., J. Berthelin, D. Tessier, and G. Lemaire. 2018. The “4 per 1000” initiative: A credibility issue for the soil science community? Geoderma 309: 118–123.
Chenu, C., D.A. Angers, P. Barré, D. Derrien, D. Arrouays, and J. Balesdent. 2019. Increasing organic stocks in agricultural soils: knowledge gaps and potential innovations. Soil and Tillage Research 188: 41-52.
Cui, Y., W. Zhang, Y. Zhang, X. Liu, Y. Zhang, X. Zheng, J. Luo, and J. Zou. 2024. Effects of no-till on upland crop yield and soil organic carbon: a global meta-analysis. Plant and Soil 499: 363–377.
Dimassi, B., B. Mary, R. Wylleman, J. Labreuche, D. Couture, F. Piraux, and J.P. Cohan. 2014. Long-term effect of contrasted tillage and crop management on soil carbon dynamics during 41 years. Agriculture, Ecosystems & Environment 188: 134–146.
Franzluebbers, A.J. 2010. Achieving soil organic carbon sequestration with conservation agricultural systems in the southeastern United States. Soil Science Society of America Journal 74(2): 347–357.
Hassink, J. 1997. The capacity of soils to preserve organic C and N by their association with clay and silt particles. Plant and Soil 191: 77–87.
Intergovernmental Panel on Climate Change (IPCC). Climate Change 2007: Synthesis Report. Available at https://www.ipcc.ch/report/ar4/syr/ (verified 24 July 2026)
IPCC. 2006. In: Eggleston, H.S., Buendia, L., Miwa, K., Ngara, T., Tanabe, K. (Eds.), IPCC Guidelines for National Greenhouse Gas Inventories Prepared by the National Greenhouse Gas Inventories Programme, Japan.
International Energy Agency (IEA). 2007. Renewables in Global Energy Supply. An IEA fact sheet. Available here.
IEA. 2016. World Energy Outlook 2016. Available at https://www.iea.org/reports/world-energy-outlook-2016 (verified 24 July 2026)
Loke, P.F., E. Kotzé, and C.C. Du Preez. 2012. Changes in soil organic matter indices following 32 years of different wheat production management practices in semi-arid South Africa. Nutrient Cycling in Agroecosystems 94(1): 97–109.
Luo, Z., E. Wang, and O.J. Sun. 2010. Can no-tillage stimulate carbon sequestration in agricultural soils? A meta-analysis of paired experiments. Agriculture, Ecosystems & Environment 139(1–2): 224–231.
Meehl, G.A., T.F. Stocker, W.D. Collins, P. Friedlingstein, A.T. Gaye, J.M. Gregory, A. Kitoh, R. Knutti, J.M. Murphy, A. Noda, S.C.B. Raper, I.G. Watterson, A.J. Weaver and Z.-C. Zhao. 2007. Global Climate Projections. In: Climate Change 2007: The Physical Science Basis. Contribution of Working Group I to the Fourth Assessment Report of the Intergovernmental Panel on Climate Change [Solomon, S., D. Qin, M. Manning, Z. Chen, M. Marquis, K.B. Averyt, M. Tignor and H.L. Miller (eds.)]. Cambridge University Press, Cambridge, United Kingdom and New York, NY, USA. Available at https://www.ipcc.ch/report/ar4/wg1/ (verified 24 July 2026)
Minasny, B., B.P. Malone, A.B. McBratney, D.A. Angers, D. Arrouays, A. Chambers, V. Chaplot, Z.-S. Chen, K. Cheng, B.S. Das, D.J. Field, A. Gimona, C.B. Hedley, S.Y. Hong, B. Mandal, B.P. Marchant, M. Martin, B.G. McConkey, V.L. Mulder, S. O’Rourke, A.C. Richer-de-Forges, I. Odeh, J. Padarian, K. Paustian, G. Pan, L. Poggio, I. Savin, V. Stolbovoy, U. Stockmann, Y. Sulaeman, C.-C. Tsui, T.-G. Vågen, B. van Wesemael, and L. Winowiecki. 2017. Soil carbon 4 per mille. Geoderma 292: 59–86.
Powlson, D.S., C.M. Stirling, M.L. Jat, B.G. Gerard, C.A. Palm, P.A. Sanchez, and K.G. Cassman. 2014. Limited potential of no-till agriculture for climate change mitigation. Nature Climate Change 4(8): 678–683. Available at https://www.nature.com/articles/nclimate2292 (verified 24 July 2026)
Quéré, C.L., R.M. Andrew, J.G. Canadell, S. Sitch, J.I. Korsbakken, G.P. Peters, A.C. Manning, T.A. Boden, P.P. Tans, R.A. Houghton, R.F. Keeling, S. Alin, O.D. Andrews, P. Anthoni, L. Barbero, L. Bopp, F. Chevallier, L.P. Chini, P. Ciais, K. Currie, C. Delire, S.C. Doney, P. Friedlingstein, T. Gkritzalis, I. Harris, J. Hauck, V. Haverd, M. Hoppema, K.K. Goldewijk, A.K. Jain, E. Kato, A. Körtzinger, P. Landschützer, N. Lefèvre, A. Lenton, S. Lienert, D. Lombardozzi, J.R. Melton, N. Metzl, F. Millero, P.M.S. Monteiro, D.R. Munro, J.E.M.S. Nabel, S. Nakaoka, K. O’Brien, A. Olsen, A.M. Omar, T. Ono, D. Pierrot, B. Poulter, C. Rödenbeck, J. Salisbury, U. Schuster, J. Schwinger, R. Séférian, I. Skjelvan, B.D. Stocker, A.J. Sutton, T. Takahashi, H. Tian, B. Tilbrook, I.T. van der Laan-Luijkx, G.R. van der Werf, N. Viovy, A.P. Walker, A.J. Wiltshire, and S. Zaehle. 2016. Global Carbon Budget 2016. Earth System Science Data; Katlenburg-Lindau 8(2): 605–649. Available at https://www.globalcarbonproject.org/carbonbudget/ (verified 24 July 2026)
Riggers, C., H. Weiser, C. Poeplau, C. Grüninger, and A. Don. 2021. How much carbon input is required to preserve or increase projected soil organic carbon stocks in agricultural soils in Germany? Journal of Plant Nutrition and Soil Science 184(2): 236–250.
Sanderman, J., and J.A. Baldock. 2010. Accounting for soil carbon sequestration in national inventories: a soil scientist’s perspective. Environ. Res. Lett. 5(3): 034003.
Stockmann, U., M.A. Adams, J.W. Crawford, D.J. Field, N. Henakaarchchi, M. Jenkins, B. Minasny, A.B. McBratney, V. de R. de Courcelles, K. Singh, I. Wheeler, L. Abbott, D.A. Angers, J. Baldock, M. Bird, P.C. Brookes, C. Chenu, J.D. Jastrow, R. Lal, J. Lehmann, A.G. O’Donnell, W.J. Parton, D. Whitehead, and M. Zimmermann. 2013. The knowns, known unknowns and unknowns of sequestration of soil organic carbon. Agriculture, Ecosystems & Environment 164: 80–99. Available at https://www-sciencedirect-com.prox.lib.ncsu.edu/science/article/pii/S0167880912003635 (verified 24 July 2026)
VandenBygaart, A.J., E.G. Gregorich, and D.A. Angers. 2003. Influence of agricultural management on soil organic carbon: A compendium and assessment of Canadian studies. Can. J. Soil. Sci. 83(4): 363–380.
West, T.O., and W.M. Post. 2002. Soil organic carbon sequestration rates by tillage and crop rotation. Soil Science Society of America Journal 66(6): 1930–1946.
World Bank. 2004. World development indicators 2004. Washington, DC: World Bank. Available at https://documents.worldbank.org/en/publication/documents-reports/documentdetail/517231468762935046 (verified 24 July 2026)
Author’s note 11 Feb 2019: References to Hassink (1997) and Chenu et al. (2019) were added; some minor editorial changes in the text body are reflected.
Author’s note 13 Jan 2020: Panel (B) was replaced with a box-and-whisker plot; the same data is portrayed as before. Some editorial changes are also reflected in the accompanying discussion and interpretation for clarity.
Author’s note 24 Jan 2026: But wait, there’s more! The debate has continued since 2017 with no sign of ending. The dubious ‘4 per 1000 initiative’, launced at COP21, lives on @ https://4p1000.org/?lang=en. Similar initiatives continue to spring up that embrace equally questionable scientific ideas. A selection of post-2020 articles has been added to the reference list.
Disclaimer: Links to digital content in this blog are for the reader’s information only, not an endorsement of that content.